Rosemary Cyriac is a graduate student in the Department of Civil, Construction, and Environmental Engineering at North Carolina State University. She is working with her adviser Casey Dietrich on a North Carolina Sea Grant research project to improve hurricane and storm surge guidance to emergency managers of the coastal counties in the state. They are collaborating with Rick Luettich at the University of North Carolina at Chapel Hill Institute of Marine Sciences, Brian Blanton at the Renaissance Computing Institute, known as RENCI, and Jason Fleming with Seahorse Coastal Consulting.
When tropical storms are approaching, local, state and federal emergency managers seek visualizations of geographic data — and they need the complex data to work in common geographic systems, such as GIS and Google Earth.
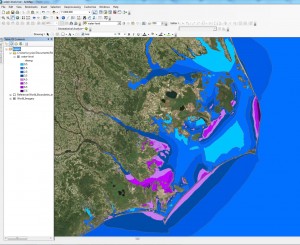
Screen-shot of the visualization (in ArcMap) of maximum water levels (in feet) along the NC coast predicted by ADCIRC based on NHC Advisory 12 for Hurricane Arthur.
Such data come from ocean models that attempt to predict how the ocean behaves in the presence of specified wind, wave and tide conditions. Our research team uses ADCIRC, a model focused on the coastal ocean. It is widely used to predict inundation and flooding levels that can be used for engineering design and evacuation decisions. Prior to extreme weather events like hurricanes, these predictions provide valuable information about the nature of the impending event.
When a tropical storm or hurricane develops in the open ocean, the National Hurricane Center, known as NHC, issues advisories that anticipate the track and intensity of the wind field. These advisories predict when and where the hurricane is expected to make landfall, even when the storm is far away from the coast.
This information serves as an input for the ocean model, which then predicts the water levels or storm surges, and wave heights created by these winds at various locations along our coastline for the coming days. These results will convey a greater meaning to the end user when visualized properly. The chief objective for our project is to improve the communication of these model outputs to the end-user by producing them in popular file formats like that of GIS based shapefiles and KMZ files used in Google Earth.
The Coastal Emergency Risk Assessment — or CERA — website provides an online interface for visualizing the model results from ADCIRC. The system automatically detects every new advisory released by the NHC and carries out a model simulation based on the input from these advisories. The results of each simulation are visualized and archived in the CERA website. During non-hurricane conditions, this system makes use of the latest meteorological input from NOAA to run the model.
Over the last six months, I have written software to convert our model outputs into two vector- and polygon-based formats – shapefiles compatible with ArcGIS, and KMZ files for Google Earth. The goal is to provide ADCIRC results to local emergency managers in familiar formats, so that the information can be integrated as separate layers with other data available in those formats.
My efforts were mainly to extract information from the high-density ADCIRC output files, identify contour levels and draw polygons representing the contours according to the specifications required for shapefiles (.shp format) and KMZ files (.kmz format). These steps were programmed in Python, a high-level programming language with immense capabilities.
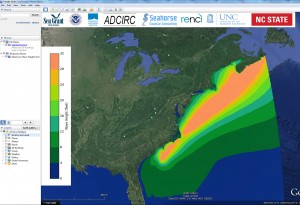
Screen-shot of the visualization (in Google Earth) of maximum wave heights (in feet) in the Atlantic basin predicted by ADCIRC based on NHC Advisory 12 for Hurricane Arthur.
The images included here show ADCIRC predictions for Hurricane Arthur, which made landfall in the North Carolina coast in the first week of July. The predictions were made after the storm’s Advisory 12 was issued by the NHC, shortly before the storm made landfall. The pictures are screenshots of the visualization of maximum water levels in ArcGIS — with a base map loaded — and maximum wave heights in Google Earth.
You can easily identify the predicted trajectory of the hurricane seeing the spatial plot of the wave heights in the Atlantic basin. The second picture zooms in on the North Carolina coast to show the predicted water levels under hurricane conditions in the Outer Banks region, including surge levels of nearly 5 feet near the barrier islands.
The predictions became progressively better as the meteorological guidance (wind input) improved near landfall; the predicted water levels were within 1 foot of the observations at the NOAA tide gauge near Oregon Inlet.
Our team is working with emergency managers in North Carolina’s coastal counties and other decision makers who are interested in using these results. The results from the daily ADCIRC simulations carried out at RENCI, based on daily meteorological conditions, are sent in shapefile and KMZ formats to these individuals. The eventual goal is to add these formats into the CERA website and make them available for easy downloading by anyone interested in predictions of wave and flooding conditions along our state’s coast.