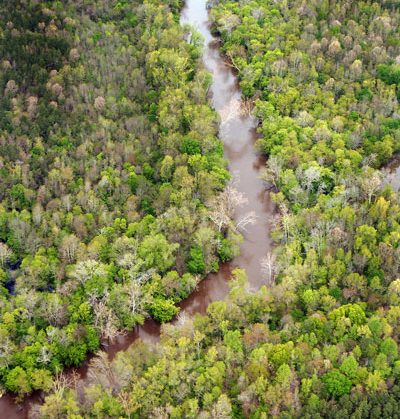
ABOVE: The Neuse River flows east from Raleigh to the North Carolina coast. Photo by Roger Winstead/NC State Communications.
Fish kills are a major problem in some North Carolina estuaries. Thousands of fish die, affecting fishing and recreation activities. These fish kills are caused by algal blooms that can produce toxins and starve water of the oxygen necessary to support finfish and shellfish.
Nutrients, such as nitrogen and phosphorus, can cause algal blooms when they are introduced into a watershed. These nutrients, which degrade water quality, come from various sources: fertilizers used in agriculture and on residential lawns, animal waste from pets and livestock, and discharge from wastewater treatment plants. When washed into estuaries, these nutrients become food for algae, which can trigger an algal bloom.
In the past couple of decades, nitrogen has been increasing in the Neuse River. Urbanization and livestock also have increased dramatically, and may be contributing to this increase. I am developing a model to determine the sources of this nitrogen increase, with the goal of informing management strategies to improve water quality in the Neuse River Estuary.
This summer, I am putting the final touches on the model to examine trends in nitrogen loading — how much nitrogen is present each year in the Neuse river basin. My model will identify and quantify nitrogen sources and predict downstream conditions based on scenarios such as urban growth and changes in livestock production. The data can help water-resource managers develop effective strategies to control nutrient loadings, potentially leading to the prevention of excessive algal blooms and fish kills.
In addition, my model will feed into a water-quality forecasting model for the Neuse River Estuary, which is being developed by Alexey Katin, who wrote about his research here. Both of us are graduate students of Dr. Dan Obenour at NC State University’s Department of Civil, Construction and Environmental Engineering.
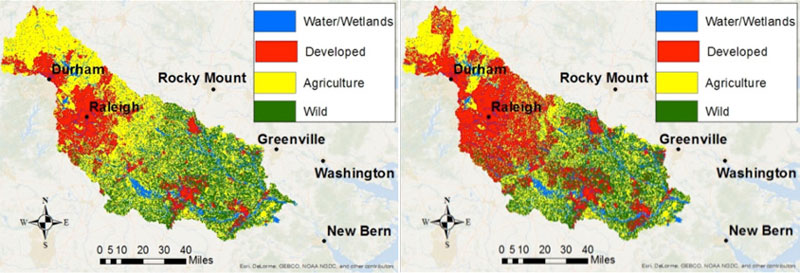
These maps show land use in the Neuse River Basin in 1992 (left) and 2012 (right).
To understand what is happening today, I looked back. I reconstructed historical nitrogen loads for 21 locations in the Neuse, Cape Fear and Tar Pamlico river basins from 1982 to the present using a technique developed by the U.S. Geographical Survey, or USGS. I used data from three basins to get a bigger picture of nutrient loads, which will help in developing our model. Water quality and flow data came from the Water Quality Portal, which compiles state, U.S. Environmental Protection Agency and USGS data. My results show that nitrogen loads have been increasing over the past 35 years, a trend that is consistent with past studies as well.
Right now, we’re still investigating why nitrogen is increasing in the Neuse, Tar-Pamlico, and Cape Fear river basins. Possible causes include changes in land use, agricultural fertilizers and large farms where animals are raised in confined situations called Concentrated Animal Feeding Operations, or CAFOs.
One possible cause is urbanization, where forests and riparian buffers — vegetated areas near streams — that slow the flow of nitrogen into streams are lost to development, while lawn fertilizer usage and pet waste increase. USGS GIS datasets show that urban landscapes almost doubled from 1992 to 2012, coinciding with a decrease in agricultural and wildland areas.
Another cause could be CAFOs that store animal waste in lagoons. Contents of the lagoons are sprayed as fertilizer on fields, and some of the associated nutrients may reach streams. Census data from the United States Department of Agriculture show an increase in chicken and hog production since the early 1990s.
On the other hand, data obtained from the Department of Environmental Quality show a reduction in nitrogen loads from wastewater treatment plants (human waste) and industries until about 2010, indicating that these sources are not a substantial factor in this upward trend in nitrogen loading.
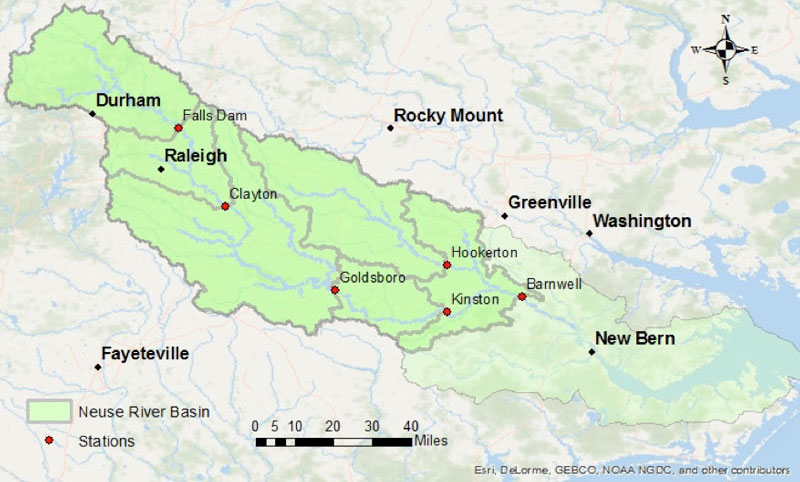
I gathered data on nutrients from six stations along the main stem of the Neuse River.
The model will estimate nitrogen contributions from potential sources in each of the 21 watersheds. It also will consider precipitation and in-stream retention — nitrogen that settled into stream beds and denitrification where biological processes eliminate nitrogen in the water — because they can influence nitrogen transport through a watershed.
Taken together, trends in nitrogen sources, precipitation and in-stream losses will allow us to map out regional changes in nitrogen loading over time. For example, we can compare loading contributions from highly developed and agricultural areas, factoring in regional differences in precipitation and in-stream losses. We can also assess the effects of urban development and increased CAFO operations on downstream water quality. We seek to provide a clearer picture of the dynamics of nitrogen loading throughout these watersheds and help identify the causes of the increasing trend in nitrogen.
My goal is to wrap up the model by the end of summer. I am adding the ability to account for prior information, uncertainty and variability among watersheds and source types. By the end of the summer, I plan to have estimates of the annual nitrogen contribution from each source, an analysis of how nitrogen loadings change over time and by location throughout the watersheds, as well as how confident I am of these estimates.
These results will help us determine what is causing this increasing nitrogen trend. In turn, this information may lead to more effective nutrient management programs to reduce hypoxia and fish kills in North Carolina’s estuaries.
Hayden Strickling is working on his master’s degree in civil engineering at NC State University.