Which Region’s Saltwater Anglers Catch the Most Fish?

Is it the Atlantic Coast, Gulf of Mexico, or Pacific Coast?
If you’re a fan of fisheries facts, stats and trivia, I have a document for you. Every year for over a century, NOAA Fisheries has compiled and published Fisheries of the United States, a comprehensive and technical yearbook of U.S. marine fisheries, including statistics on recreational and commercial fishing, marine aquaculture, seafood trade data, seafood disposition and seafood consumption. If fishery questions ever made Trivial Pursuit, I bet the boardgame would draw from this series of government reports.
Research Need
Compiling the same types of data for recreational fisheries on an annual basis allows scientists to make comparisons and analyze trends. It also takes a lot of time. That’s why today, in early May 2020, we can only look at data collected in 2018.
Incidentally, if you want to know more about 2018 recreational data specifically from North Carolina, read our previous post. After all, the North Carolina Division of Marine Fisheries collects most of the North Carolina data that goes into the national report.
So, who’s fishing the most — and, more importantly, who catches the most fish?
What Did They Find?
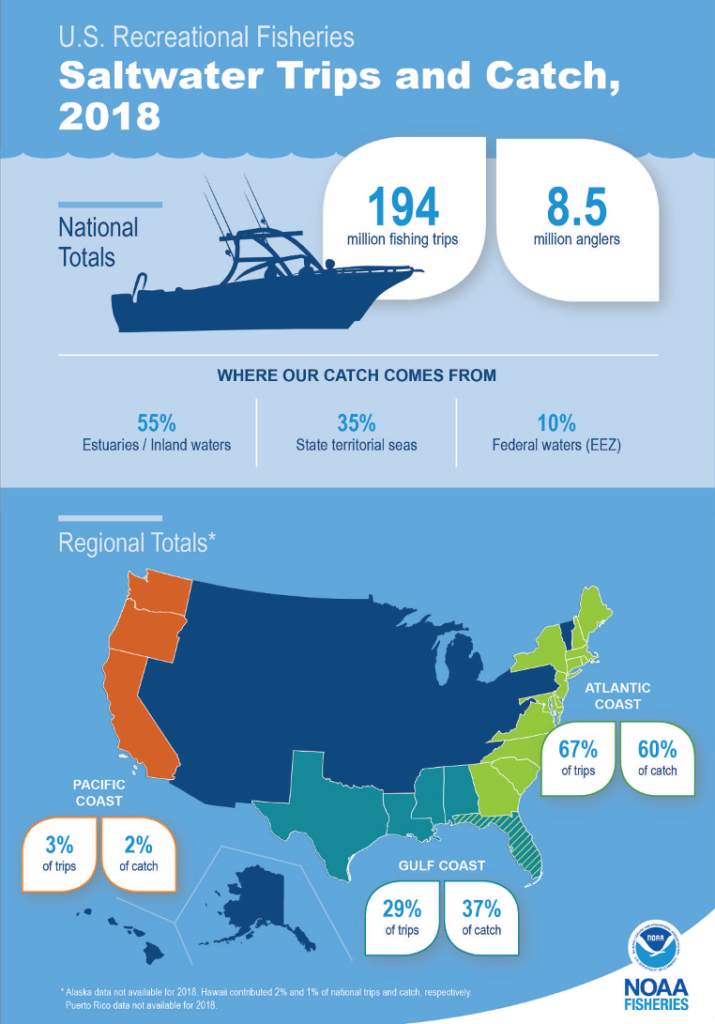
About 8.5 million anglers took 194.5 million saltwater fishing trips in 2018 and caught 956 million fish. They released 64% percent of the catch alive.
The Atlantic coast was responsible for 67% of the country’s recreational fishing trips and 60% of its catch.
The Gulf coast accounted for 29% of trips and 37% of catch.
Surprisingly, the Pacific coast only accounted for 3% of trips and 2% of catch. Data from Alaska was not available for the report, but even if Alaska sport-fishing data were included, it would not have changed the standings. A look back at the last 5 years reveals similar trends.
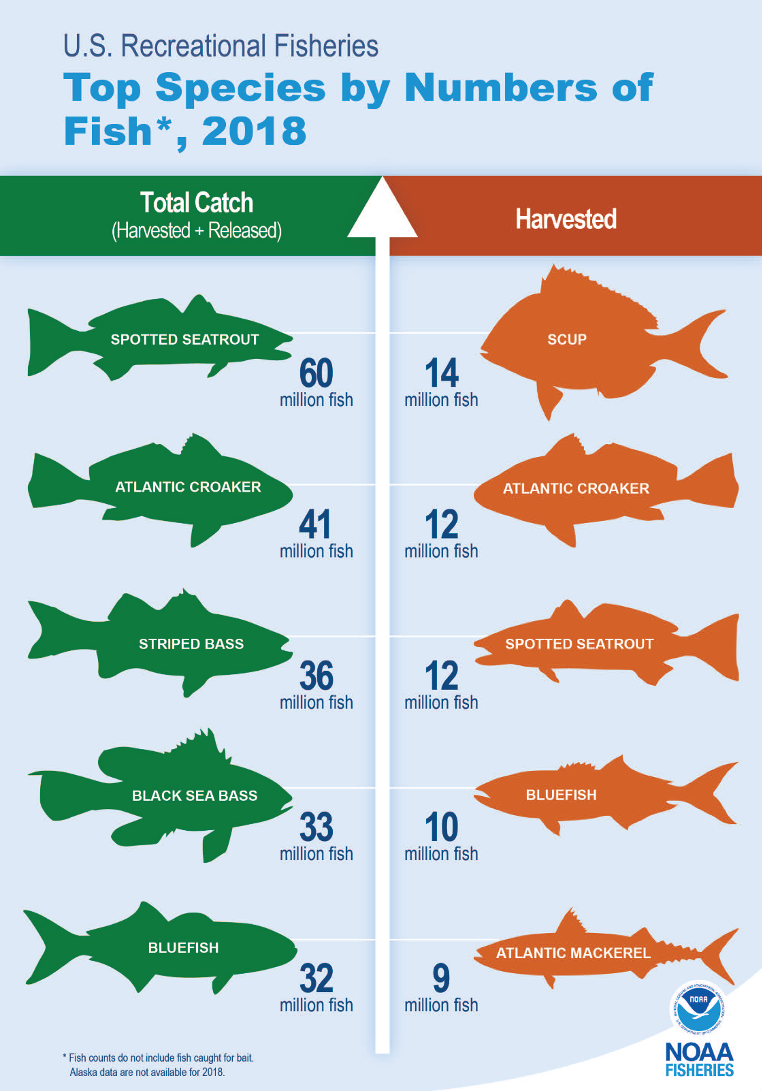
Harvest and effort have decreased over the past five years, while the proportion of catch released continues to rise. Spotted seatrout and Atlantic croaker comprise 10% of the total catch nationally.
The accompanying infographics from NOAA Fisheries show other trends, too.
Anything else?
These statistics provide a great snapshot of the status of our fisheries – but we should look at them with other biological, social, and economic factors to get a better picture of total ecosystem and ocean health.
Reading
Fisheries of the United States 2018. Visit https://www.fisheries.noaa.gov/feature-story/fisheries-united-states-2018 to view copies of the full report, summary report and complete set of infographics.
To view Alaska Fish and Game recreational fishing data totals, visit: https://www.adfg.alaska.gov/sf/sportfishingsurvey/
Summary compiled by Scott Baker
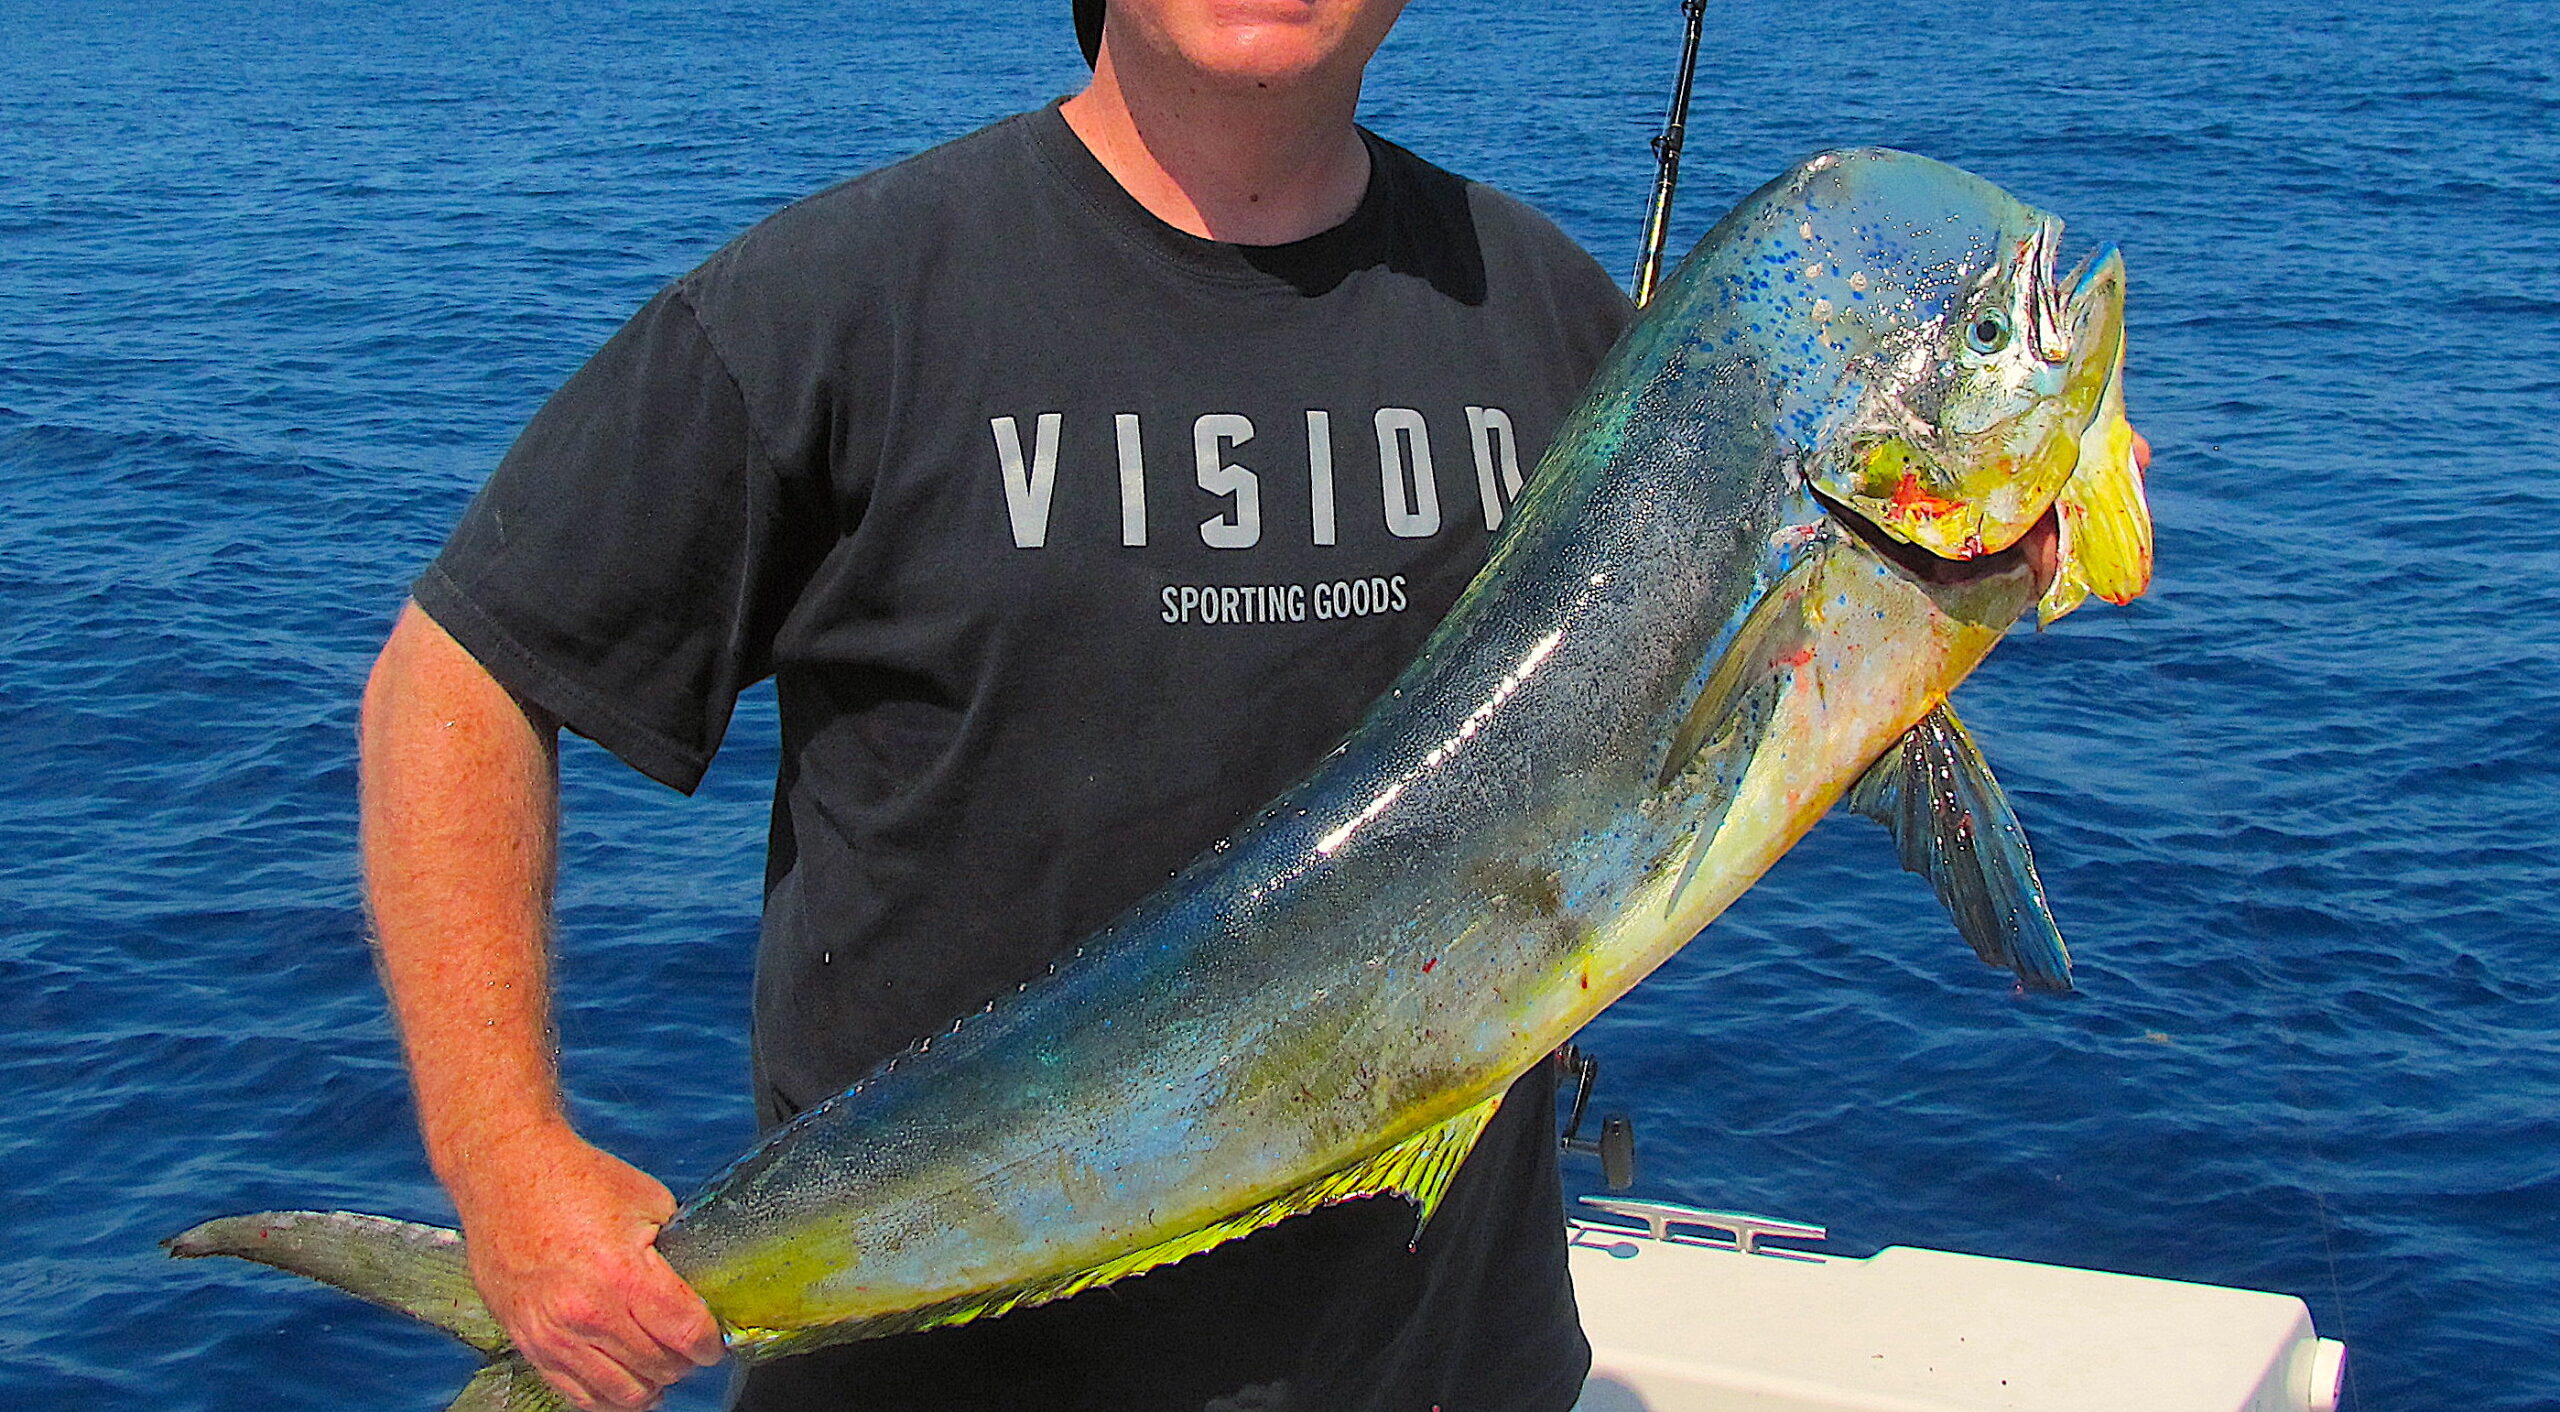
Lead photo by Scott Baker
The text from Hook, Line & Science is available to reprint and republish, but only in its entirety and with this attribution: Hook, Line & Science, courtesy of Scott Baker and Sara Mirabilio, North Carolina Sea Grant. HookLineScience.com