To find the answers, it’s literally gut-check time.
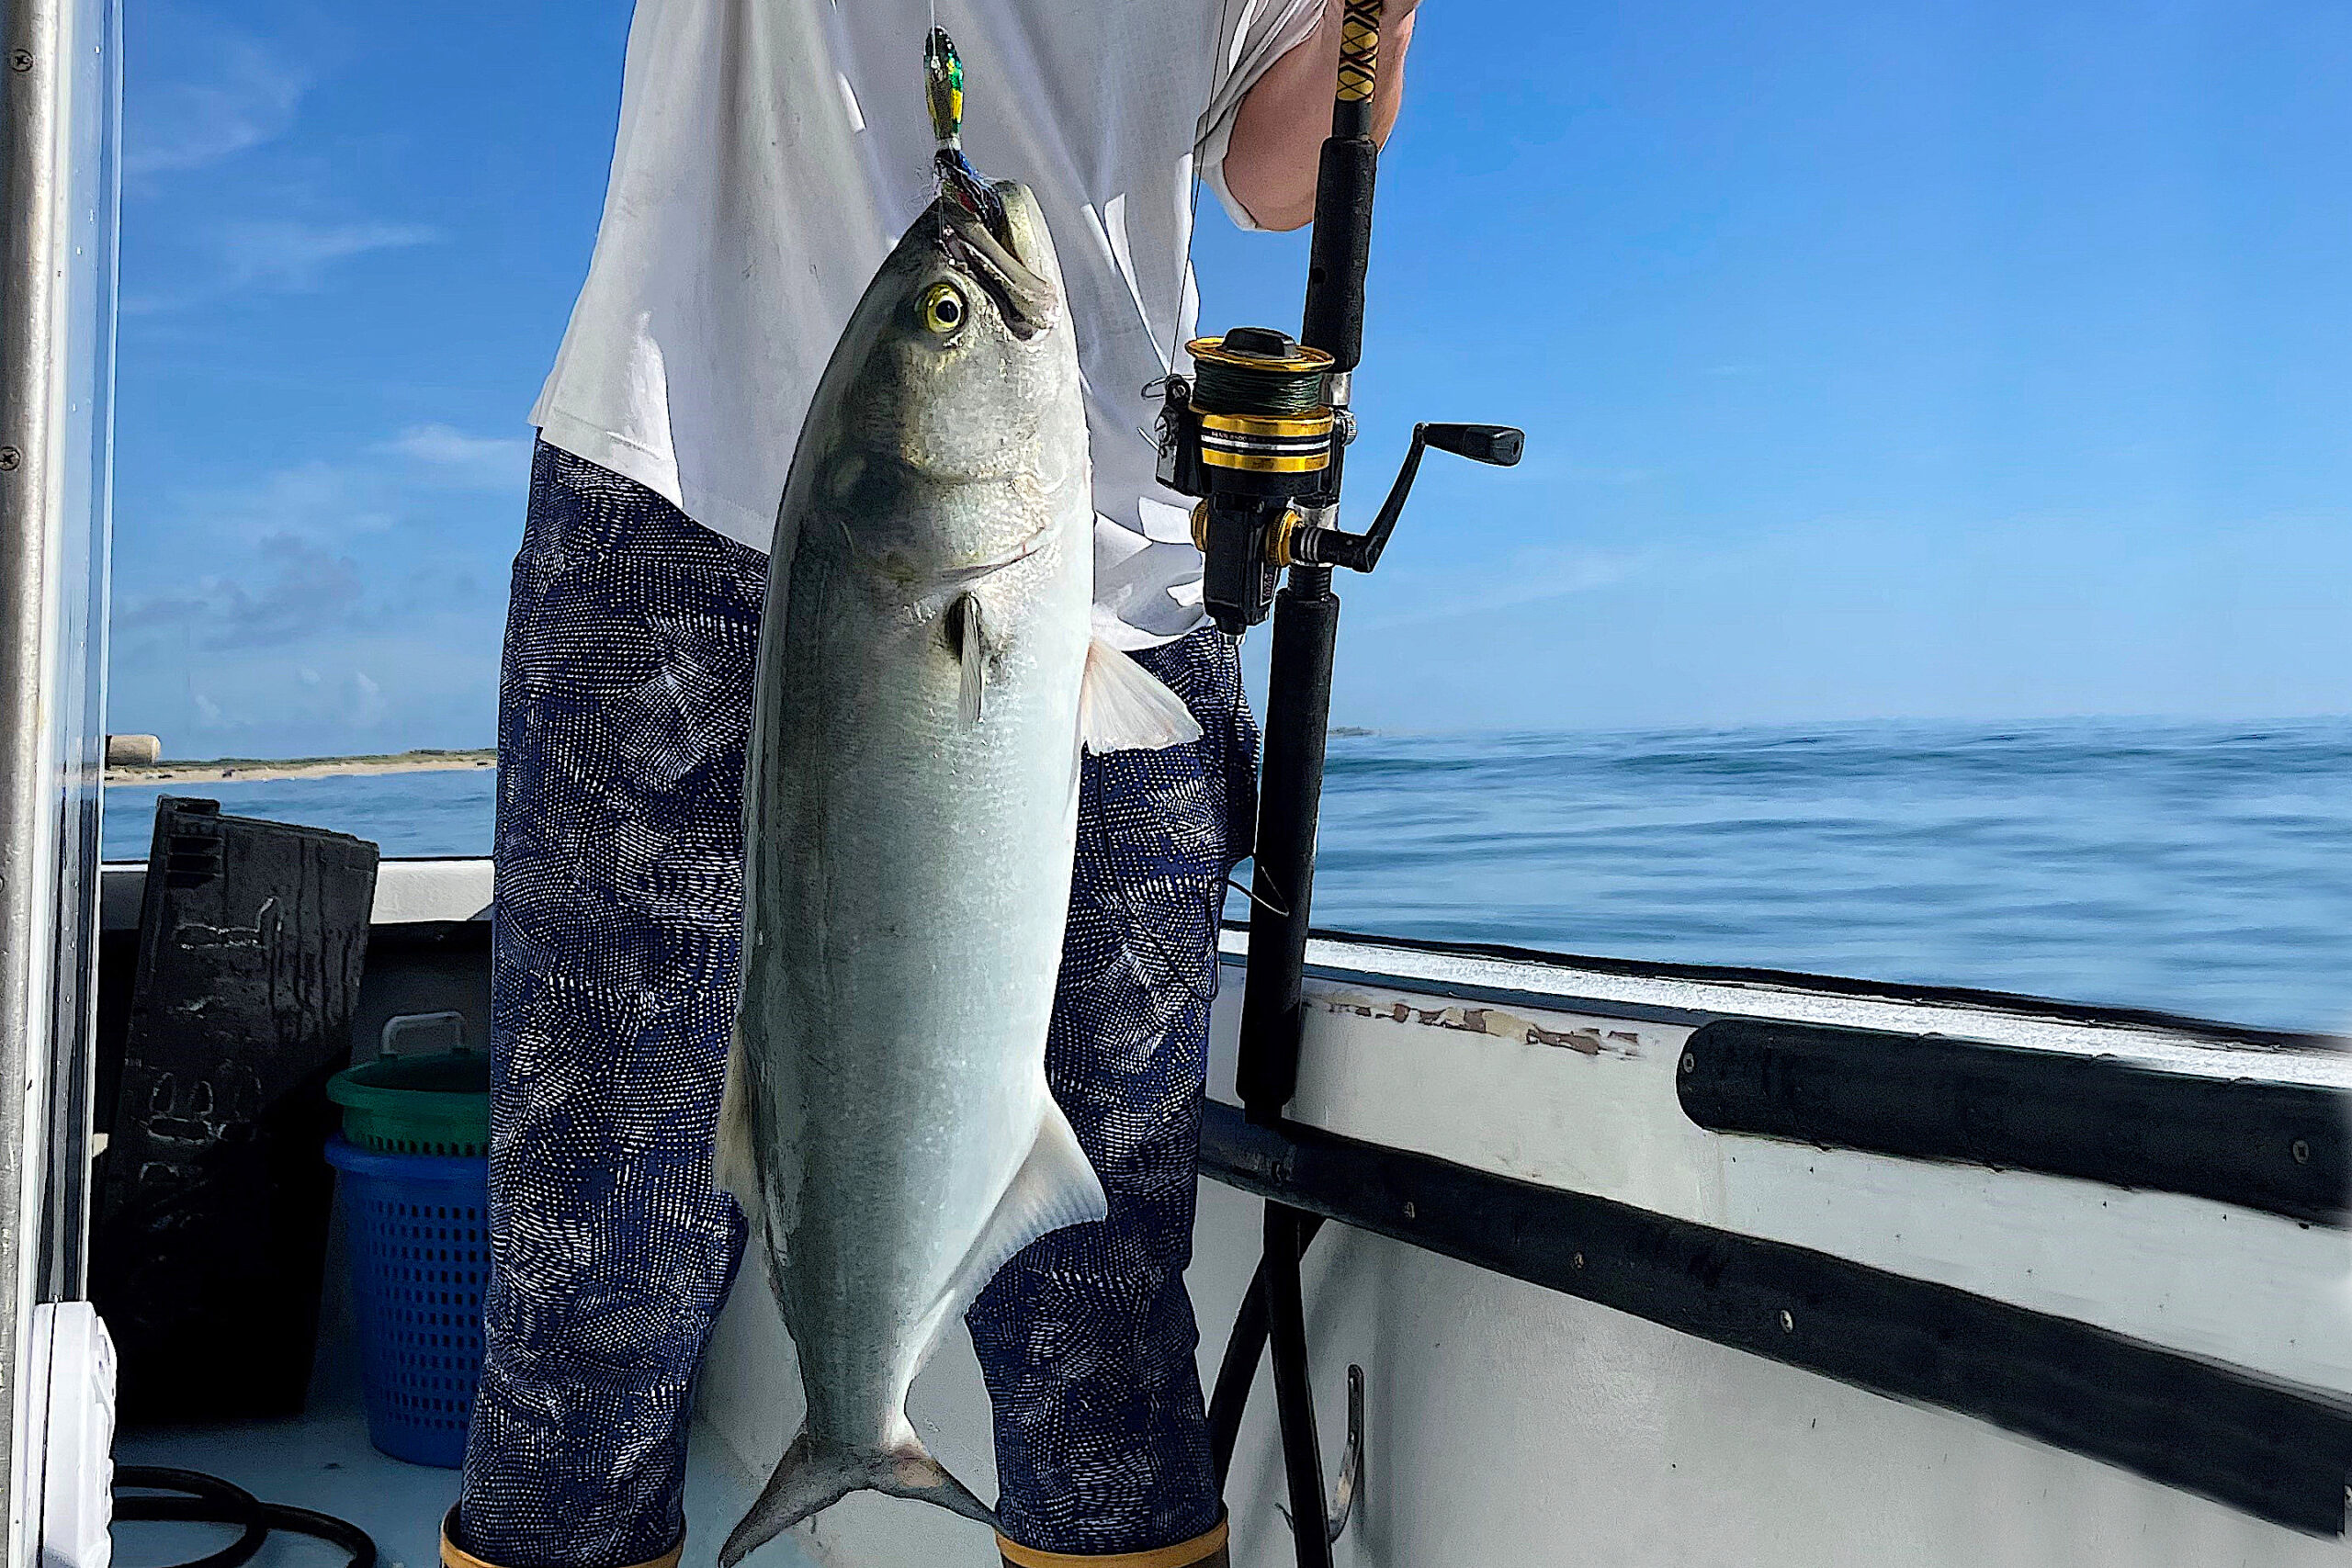
On February 1st, the limit for recreationally catching bluefish in North Carolina coastal waters decreased to three fish per person per day. The action is intended to reduce the coastwide recreational harvest from Maine to Florida by 28.6%. But are current population assessment methods accurately depicting the availability of bluefish?
Research Need
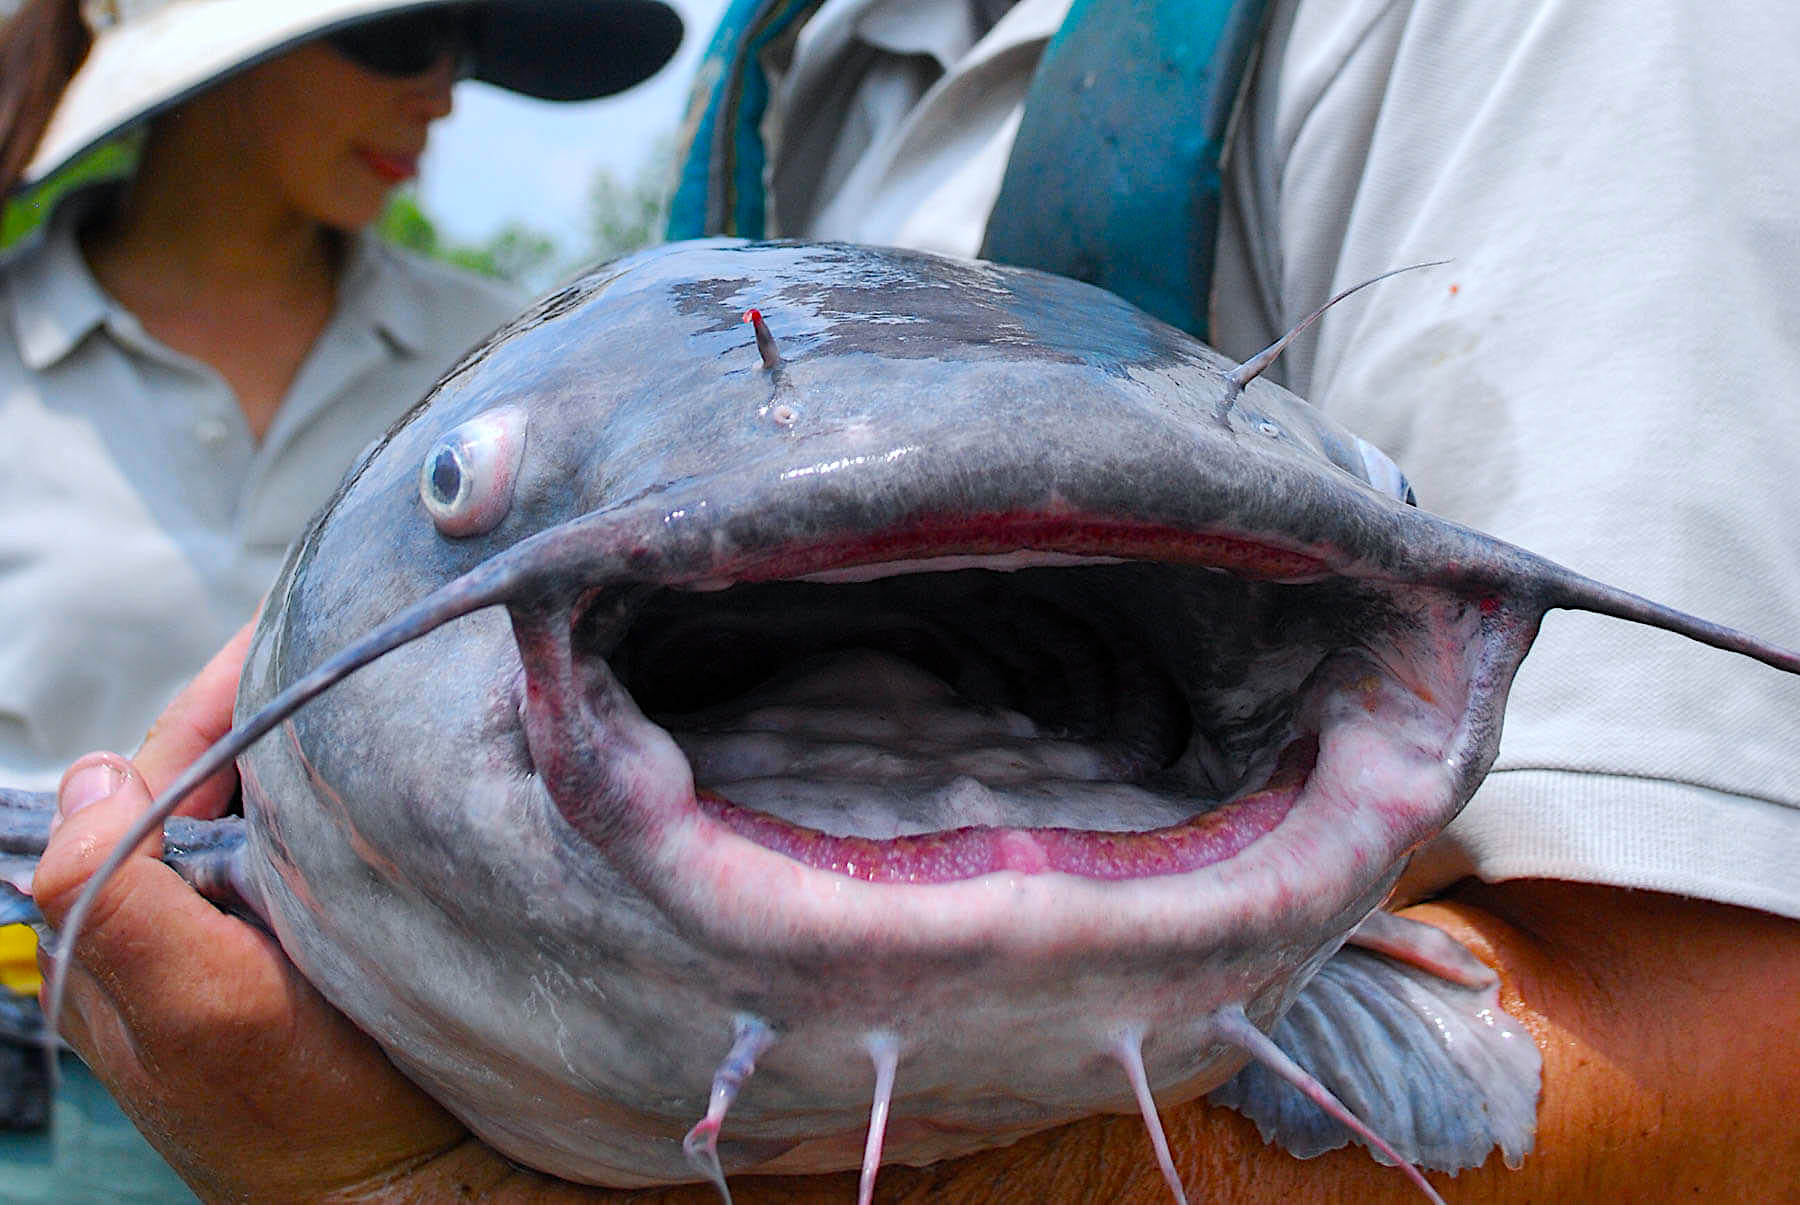
Besides their recreational and commercial value, bluefish are an important part of the food web. While they are voracious predators of smaller fish and crustaceans, they also are prey for larger animals, including tunas and sharks.
This proves challenging to biologists who are trying to determine the size of the bluefish population using traditional survey methods. But what if what fish ate could help predict changes in the whereabouts of the fish?
What did they study?
The research team developed a new method for understanding the abundance and distribution of 21 small prey fish by examining the stomach contents of bluefish and similar predators from Maine to North Carolina. The contents came from inshore and offshore surveys from 1985 to 2021 with net tows at depths 30 to 1,200 feet.
The team used the information to create a model of bluefish availability that incorporated information on the number and size of predators and sea surface temperatures at each survey location.
What did they find?
The stomach samples collected for bluefish indicate that anchovies, herrings, squids, butterfish, scup, and small hakes are important prey.
Bluefish diets, however, varied by decade and by season. Across all decades in the survey, spring diets consisted primarily of longfin squid and other cephalopods (such as the squid, octopus, cuttlefish, or nautilus), which comprised 30% to 60% of bluefish diet by weight. Atlantic mackerel and butterfish accounted for 5% to 10% of the spring diet by weight in some decades.
Fall bluefish diets were more diverse and fish-dominated than spring diets.
So what?
The prey index based on stomach content was able to represent populations of smaller, unmanaged species of prey that current surveys are not designed to capture and allowed for a more complete understanding of the fishery.
In ecosystems with diverse, small, open-ocean prey fish, changes in the total available prey are important to predators like bluefish that eat a wide-array of species and can influence how many fish are in a given area.
All told, recreational fishers catch 51% of their bluefish in bays and estuaries, including North Carolina’s Albemarle Sound, and 42% in state waters (from the beach out to 3 miles). However, current information on predator fish and their prey does not cover our state’s inland waters, and this study of stomach contents helps explain the numbers of bluefish available for anglers — crucial information for fisheries managers.
Reading
Gaichas, S.K., Gartland, J., Smith, B.E., Wood, A.D., Ng, E.L., Celestinod, M., Drew, K., Tyrell, A.S., and Thorson, J.T. (2024). Assessing small pelagic fish trends in space and time using piscivore stomach contents. Canadian Journal of Fisheries and Aquatic Sciences. 00: 1–23. dx.doi.org/10.1139/cjfas-2023-0093
BY SARA MIABILIO.
The text from Hook, Line & Science is available to reprint and republish at no cost, but only in its entirety and with this attribution: Hook, Line & Science, courtesy of Scott Baker and Sara Mirabilio, North Carolina Sea Grant.

- Categories: