Where Can I Find Quick and Free Info about Fish Stocks?

The new NOAA Fisheries Stock SMART Tool provides easy online access to current and historical data on federal stock assessments.
The Need
Stock assessment reports scientifically describe the current condition of fish stocks, including their size (abundance), the impacts of fishing upon them (total catch and harvest rate), their overfished and overfishing status, and the maximum harvest they can sustain over the long term.
Each NOAA Fisheries science center and Fishery Regional Fishery Management Council provides access to stock assessment reports through the web. Fishermen, nonprofits, and academics all are interested in these reports; however, given the long, complex nature of the reports, it is difficult to quickly find basic information, visualize stock status changes with time, or compare stock assessments across regions.
The Answer
NOAA Fisheries’ Office of Science and Technology’s Species Information System (SIS) is a centralized database that contains the results of stock assessments conducted since 2005.
NOAA Fisheries examined similar stock assessment data portals, reviewed its requests for information from stakeholders, and redesigned a new public-facing web tool called Stock SMART (the Stock Status, Management, Assessment, and Resource Trends Tool) to better communicate information within the SIS database. Stock SMART draws from records of federally managed stocks to enable users to easily search, view, compare, and download the results of NOAA Fisheries stock assessments. It is dynamic, more intuitive, and better tailored to stakeholder needs than the previous public portal.
Stock SMART’s features include:
- Browse by Stock, summaries of current and historical stock assessment results.
- Chart Time Series, exploration and comparison by time series of catch, abundance, fishing mortality, and recruitment (new fish added).
- Plot Stock Condition, current stock abundance and fishing mortality levels compared with their long-term population size targets.
- Count Assessments, summary level data of NOAA Fisheries stock assessment activities.
- Download Data, design specific queries and bulk record downloads.
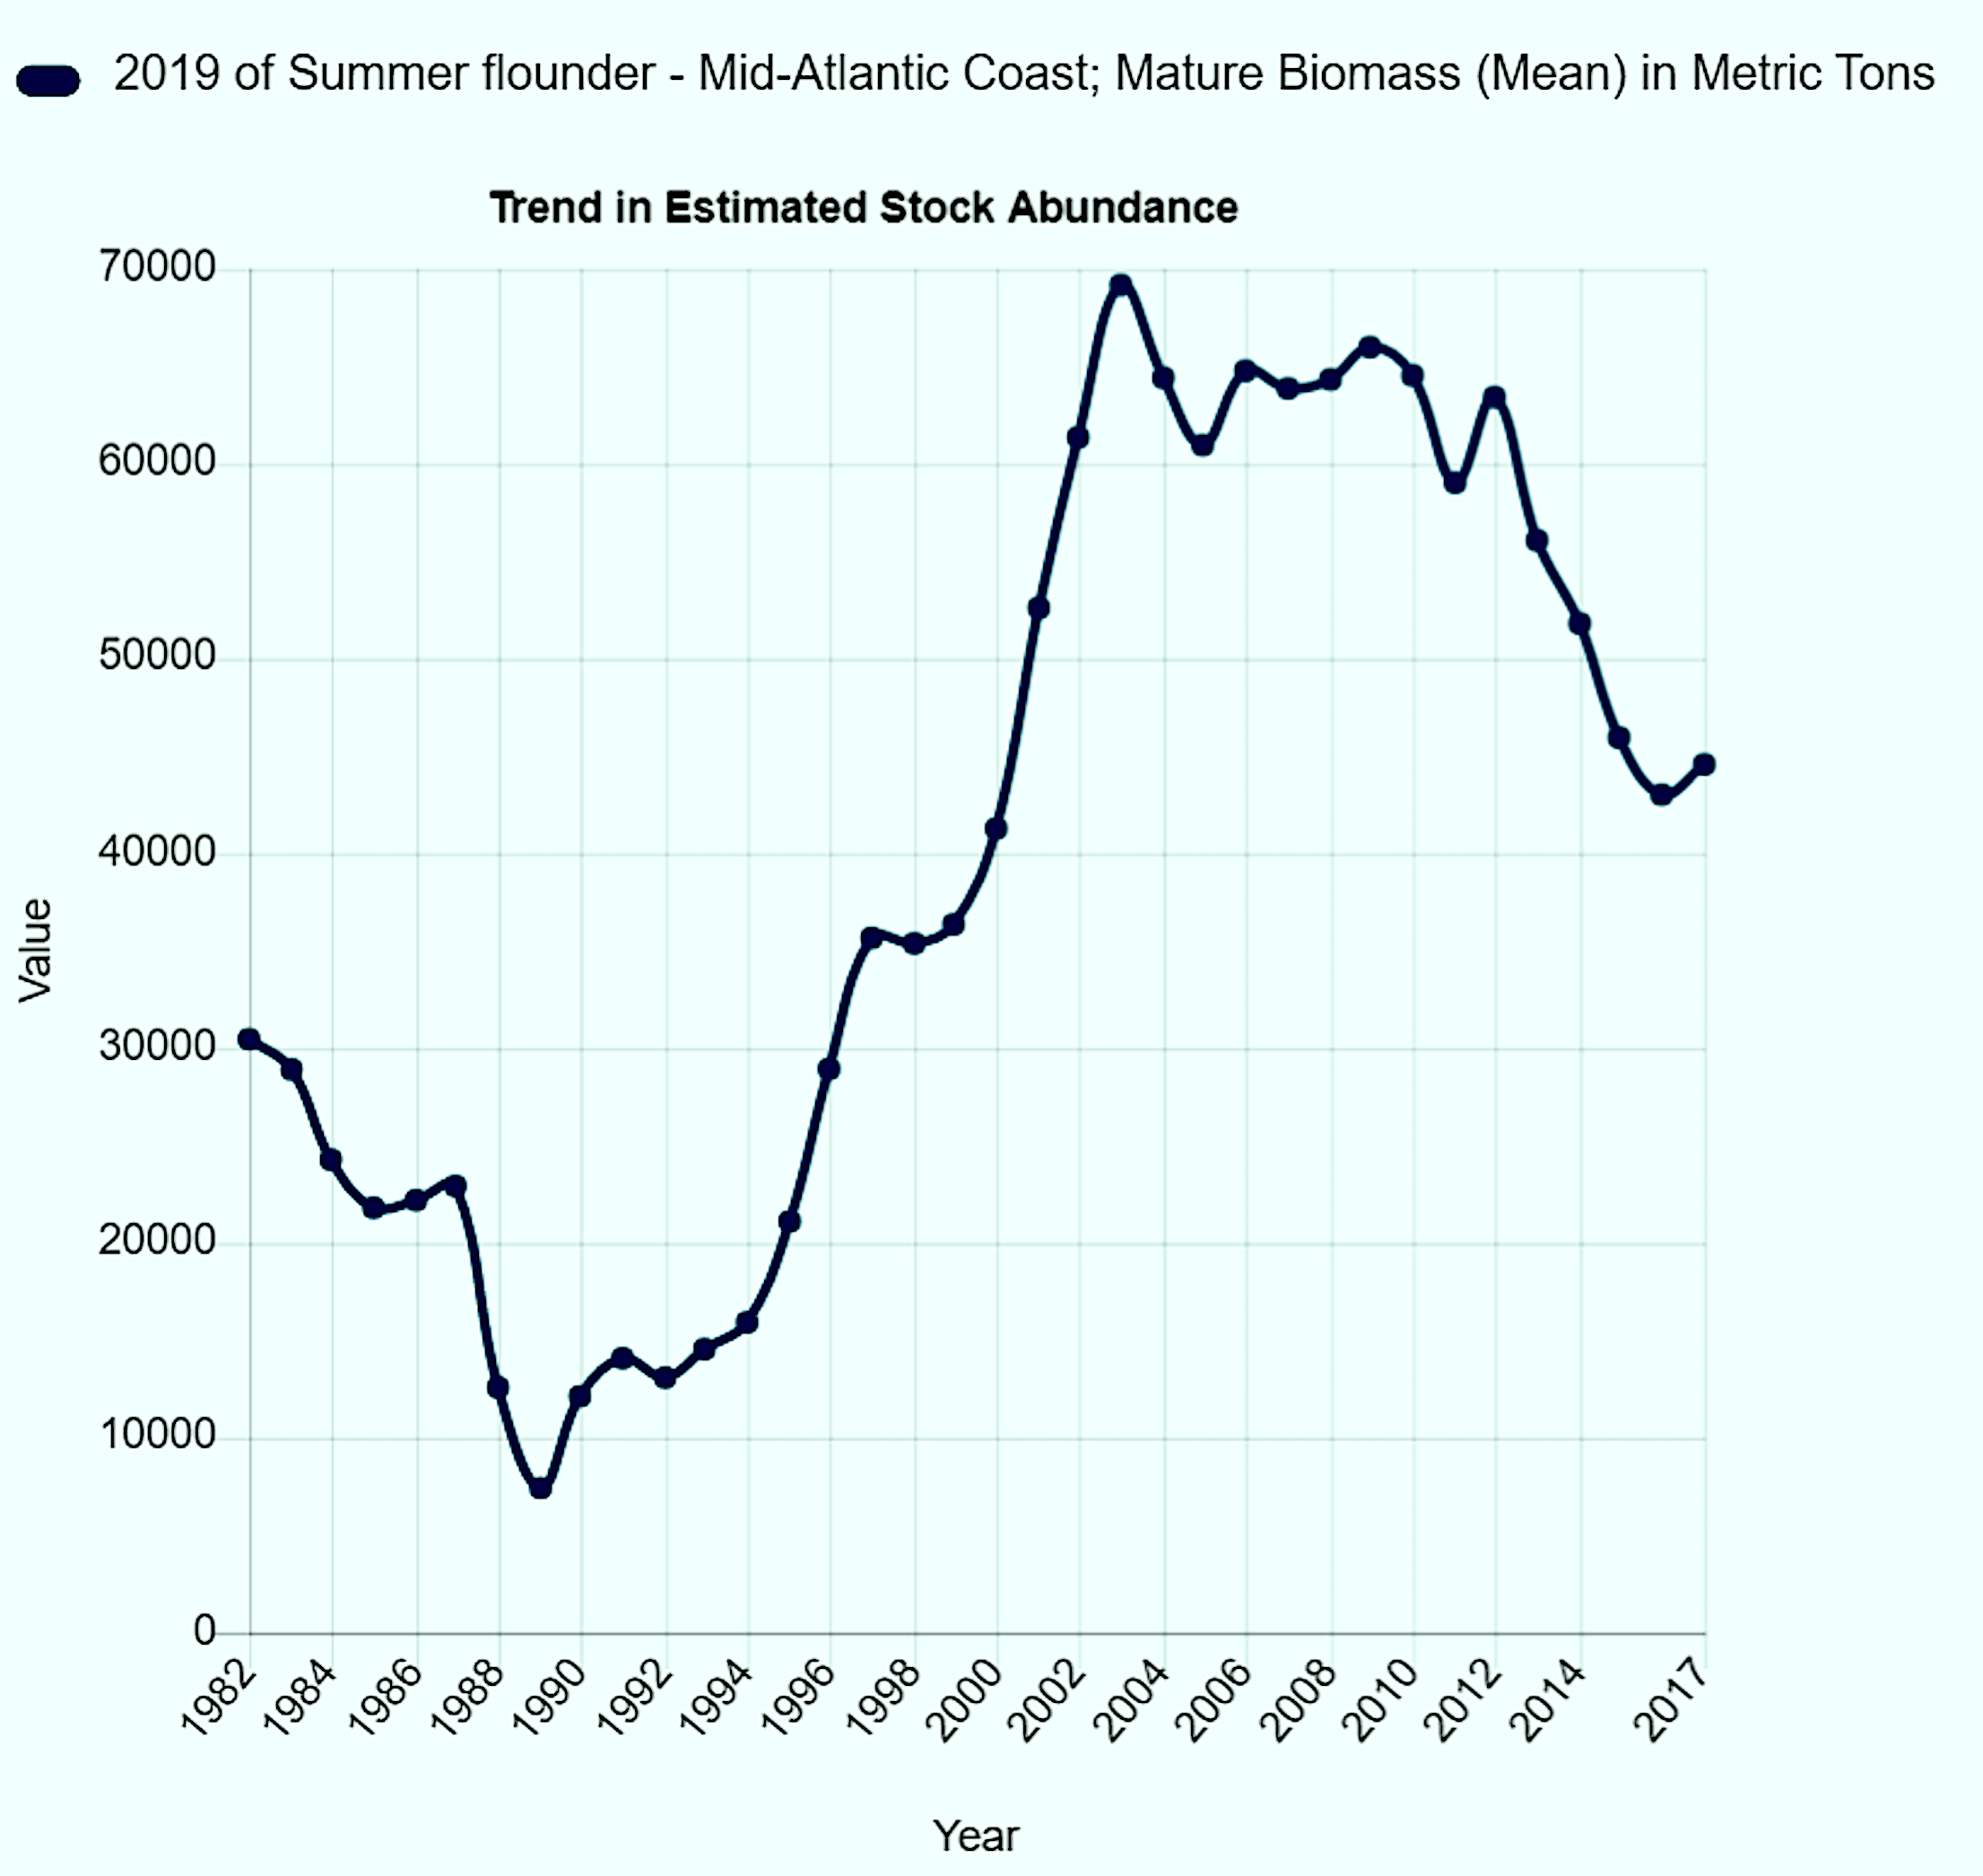
For example, using the browse by stock tool or the chart time series tool described above, users can view how the size of the Mid-Atlantic summer flounder stock has changed over the last 35 years. In this example we can see that the size of the summer flounder stock today is nearly five times what it was in 1989.

The modular design of Stock SMART will allow NOAA Fisheries to seamlessly continue to develop new features and functions and to incorporate stock status information into new and existing features.
Reading
Video overview and demonstration
Summary compiled by Abigail Furnish and Jeffrey Vieser, NOAA Fisheries Office of Science and Technology
Lead photo: blacknose shark, one of the numerous species of fish for which Stock SMART provides data, courtesy of NOAA
The text from Hook, Line & Science is available to reprint and republish, but only in its entirety and with this attribution: Hook, Line & Science, courtesy of Scott Baker and Sara Mirabilio, North Carolina Sea Grant. HookLineScience.com
- Categories:


