 BY ALEXEY KATIN
Since 2018, Daniel Obenour, an environmental engineer at NC State, has been collaborating with coastal ecologist Hans Paerl of the UNC-CH Institute of Marine Sciences on a North Carolina Sea Grant project to forecast levels of dissolved oxygen in the Neuse River Estuary. The project relies on a computational model for its predictive power. Such models are important because hypoxia — when dissolved oxygen levels fall too low — can lead to ecosystem stresses, including fish kills. When the team assessed how well their experimental model anticipated oxygen levels for summer 2018 and summer 2019, they determined their forecasts effectively matched observed conditions.
Alexey Katin is a doctoral student in civil engineering at North Carolina State University who works on the project.
The 2020 summer hypoxia forecast for the Neuse River estuary (NRE) calls for dissolved oxygen levels slightly lower than the long-term average. The forecast is based on a biogeochemical model and predicts the average bottom dissolved oxygen concentrations from July through August for three segments of the estuary: upper, middle and lower.
We forecast average bottom dissolved oxygen concentrations of 1.9, 1.7, and 2.2 mg/L for the upper, middle, and lower segments of the NRE respectively (Figure 1). Forecasted oxygen levels are near the hypoxia threshold (2.0 mg/L), which indicates increased stress on the aquatic habitat and an increased potential for fish kills during midsummer.
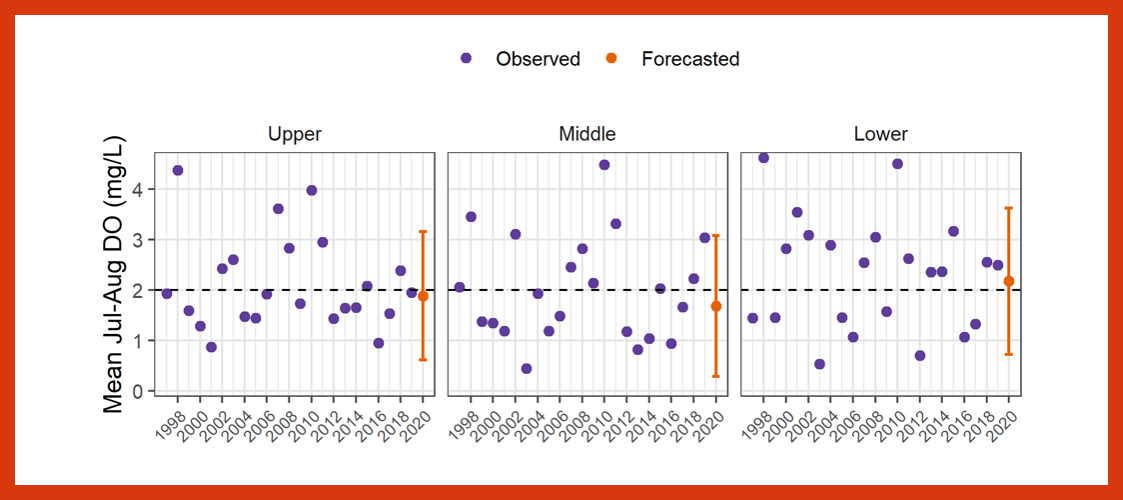
Figure 1: Observed (violet) and forecasted (orange) average bottom dissolved oxygen levels from July through August for the upper, middle, and lower segments of the Neuse River estuary. The orange bars represent 90% uncertainty intervals. The dashed line shows the threshold for dissolved oxygen for hypoxic conditions (2.0 mg/L).
This year’s forecast is based on two major factors. First, from November to April the Neuse River discharge was similar to the historical mean for these months, suggesting average buildup of organic matter during this period. Second, predicted midsummer Neuse discharge is expected to be 35% higher than the historical average due to elevated gage heights at Falls Lake and moderate streamflows from April to May.
Higher river discharge in the summer brings higher amounts of nutrients into the estuary — especially nitrogen, which consequently fuels algal production and increases oxygen demand. Higher river flows also promote stratification of the water-column; in other words, different depths of water don’t mix as much. This, in turn, inhibits dissolved oxygen from entering the estuary’s bottom waters.
The forecasted values presented here are estimates based on the data available at the end of May. The actual midsummer observed oxygen levels may deviate from the forecast due to unexpected conditions caused by extreme events, like hurricanes and droughts, as well as the timing of data collection. We’ve included these considerations in the wide predictive interval (the orange bar in Figure 1).
Last year’s hypoxia forecast successfully predicted above-average oxygen conditions within the estuary (Figure 2).
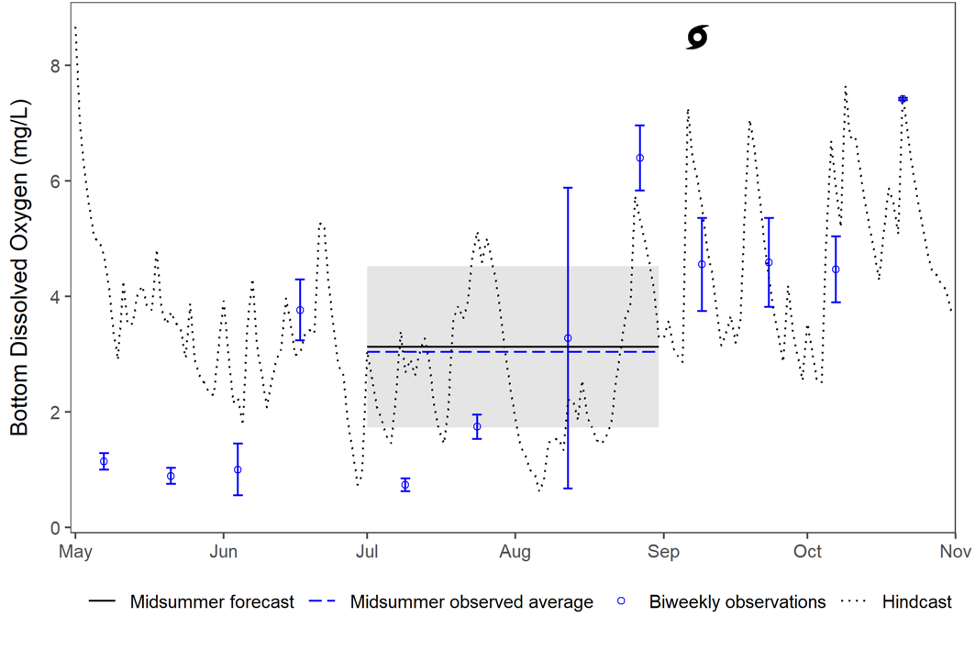
Figure 2: Forecasted, observed, and hindcasted dissolved oxygen for the Neuse River estuary (middle segment) in 2019. The storm symbol represents Hurricane Dorian. The gray band represents the 90% forecast interval, and the blue error bars represent the range of observed values.
Read about the 2019 hindcast and the impact of tropical storms on dissolved oxygen levels:
Tropical Systems Disrupt Neuse River Oxygen Levels
Read about the model:
Katin, A., Del Giudice, D., & Obenour, D. R. (2019). Modeling biophysical controls on hypoxia in a shallow estuary using a Bayesian mechanistic approach. Environmental Modelling & Software, 120, 104491. https://doi.org/10.1016/j.envsoft.2019.07.016
Acknowledgements:
These forecasts and retrospective assessments are made possible through Sea Grant funding, USGS flow gaging, NC DEQ stream water quality data, NC Climate Office weather data, and UNC ModMon estuary water quality data.
lead photo: The Neuse River in Johnston County, North Carolina, by Ken Thomas