
Neusiok Trail, along the Neuse River. Credit: Patrick Mueller/CC BY-SA 4.0 (adapted).
BY ALEXEY KATIN, postdoctoral researcher at NC State University.
Since 2018, Daniel Obenour, an environmental engineer at NC State, has been collaborating with coastal ecologist Hans Paerl of the UNC-CH Institute of Marine Sciences, on a North Carolina Sea Grant project to monitor and forecast levels of dissolved oxygen in the Neuse River Estuary. The project relies on a computational model to predict mid-summer oxygen conditions. Such models are important because hypoxia — when dissolved oxygen levels fall too low — can lead to ecosystem stresses, including fish kills. Summer forecasts for 2018, 2019, and 2020 have performed well when compared to subsequent monitoring results.
Our summer 2021 hypoxia forecast for the Neuse River Estuary calls for dissolved oxygen levels higher than the long-term average. Forecasted oxygen levels also are higher than the hypoxia threshold, which indicates a lower potential for fish kills during midsummer.
The forecast, based on a biogeochemical model, predicts the average bottom dissolved oxygen concentrations from July through August for three segments of the estuary: upper, middle, and lower.
Forecasted dissolved oxygen concentrations (Figure 1) are for 3.8 mg/L, 3.4 mg/L, and 4.1 mg/L for the upper, middle, and lower segments of the Neuse River Estuary respectively — well above the hypoxic conditions (2.0 mg/L) that often characterize fish kills.
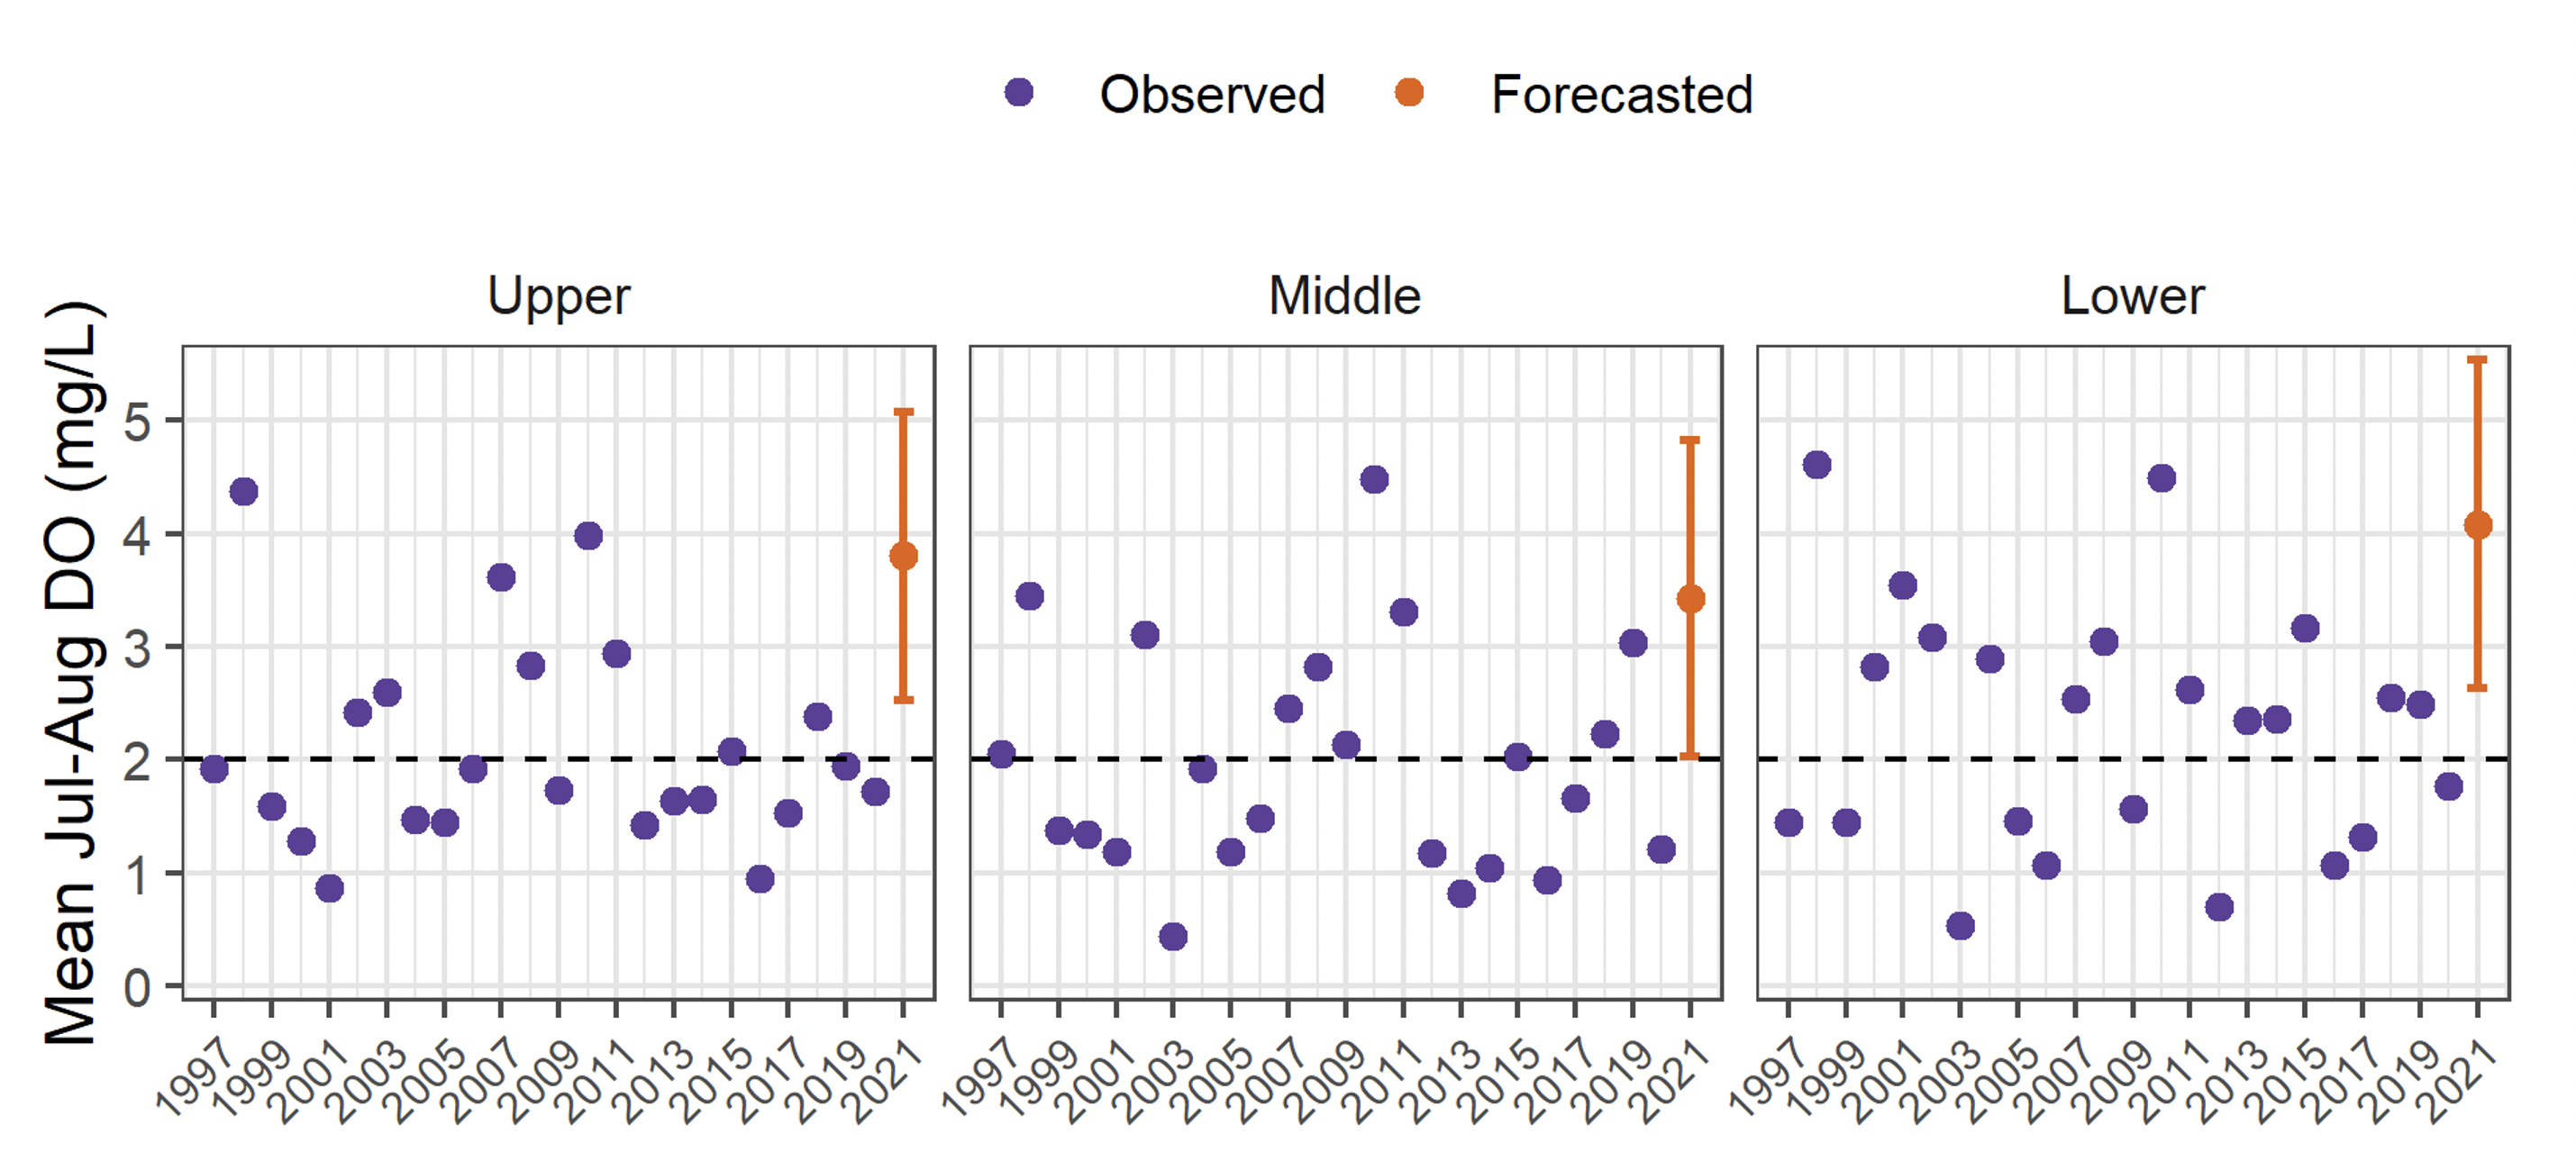
Figure 1. Historical (violet) and forecasted (orange) average bottom dissolved oxygen levels from July through August for the upper, middle, and lower segments of the Neuse River Estuary. The orange bars represent 90% uncertainty intervals. The dashed line shows the threshold for dissolved oxygen for hypoxic conditions (2.0 mg/L).
This forecast is based on two major factors. First, from November to April the Neuse River discharge was two times higher than the historical mean for these months, suggesting increased flushing of organic matter during this period.
Second, predicted midsummer Neuse discharge is lower than the historical average due to slightly lower gage heights at Falls Lake and reduced stream flows from April to May — 33% less, in fact, than the historical average for that time period. Lower river discharge in the summer brings fewer nutrients into the estuary — especially nitrogen, which consequently may limit summer algal production and decrease bottom-water oxygen demand.
The forecasted values presented here are estimates based on the data available at the end of May. The actual midsummer observed oxygen levels may deviate from the forecast due to unexpected conditions caused by extreme events, like hurricanes and droughts, as well as the timing of data collection. We’ve included these considerations in the wide predictive interval (the orange bars in Figure 1).
Last year, dissolved oxygen levels in the Neuse Estuary were below average, consistent with the 2020 forecast (Figure 2). Hindcast simulations (conducted at the end of 2020) show how tropical storms temporarily elevated oxygen levels. Oxygen levels remained below-average in fall, contributing to unusually severe fish kill events.

Figure 2. Forecasted, observed, and hindcasted dissolved oxygen for the Neuse River Estuary (middle segment) in 2020. The storm symbols represent Hurricane Isaias (August) and st›rong winds (mid-September). The gray band represents the 90% forecast interval, and the blue error bars represent the range of observed values.
more about the model:
Katin, A., Del Giudice, D., & Obenour, D. R. (2019). Modeling biophysical controls on hypoxia in a shallow estuary using a Bayesian mechanistic approach. Environmental Modelling & Software, 120, 104491. https://doi.org/10.1016/j.envsoft.2019.07.016.
media coverage of Neuse River fish kills:
Month-Long Fish Kill in the Neuse Is Testament of River’s Dire Condition
Marine Experts Say Neuse River Fish Kill Is Worst In Decades
related: