Science Needs You: Monitoring and Assessing Water Quality Across the Neuse River Estuary-Pamlico Sound Continuum
For decades, researchers have been tracking the health of the second largest estuarine complex in the United States — and you can help, too.

Just north of Durham, the Eno River and the Flat River join to form the Neuse River, one of the oldest rivers in the country at approximately 2 million years old. It runs rapidly for about 150 miles before slowing to a crawl and spreading out to form the brackish, tea-colored Neuse River Estuary, which then empties into the Pamlico Sound.
Archaeologists have shown that human settlements have existed around the river and estuary for the past 14,000 years. The name “Neuse” means “peace” and was taken from the Neusiok tribe with whom early European explorers connected in the 16th century.
Today, the ModMon and FerryMon programs monitor water quality trends throughout the Neuse River Estuary and Pamlico Sound, and you can help. For that matter, you can assess any body of water that you believe may need monitoring for the health and safety of the environment.
Read on to learn how you can be involved in measuring water quality and aid researchers in their efforts to monitor the health of our coastal waters.
Why the Neuse River Estuary Is Important
An estuary is a semi-enclosed, transitional body of water where fresh water from a river mixes with saltwater derived from the ocean. Estuaries are impacted by tides but are often shielded from powerful ocean waves by barrier islands or reefs that border them. They are critical zones of environmental importance.
Estuaries are highly productive and beneficial habitats for many types of finfish and shellfish. In the United States, approximately 90% of recreationally caught fish and 75% of commercially caught fish spend part of their lives in estuaries.
The Neuse River Estuary is a major tributary of the second largest estuarine complex in the United States and North Carolina’s most important water body, the Albemarle-Pamlico Sound. This is a very important fisheries nursery, meaning that, for marine organisms living here, the estuary provides a hospitable and protective habitat, as well as a food source for their young while they mature. In North Carolina, businesses or activities that deal with fish and shellfish — including harvesting, buying, and selling — contribute about $1.7 billion per year to the state’s economy.
There are currently about 3.9 million people living within the Albemarle-Pamlico Sound Watershed area. In addition to the human population, this region also contains 16,000 farms and 4.8 million acres of farmland, including swine and poultry operations. With a large number of people building homes and businesses and managing farms in this watershed, it is very important that this estuarine system be closely monitored to ensure it is productive, healthy, and safe for future generations.
Ongoing Water Quality Monitoring
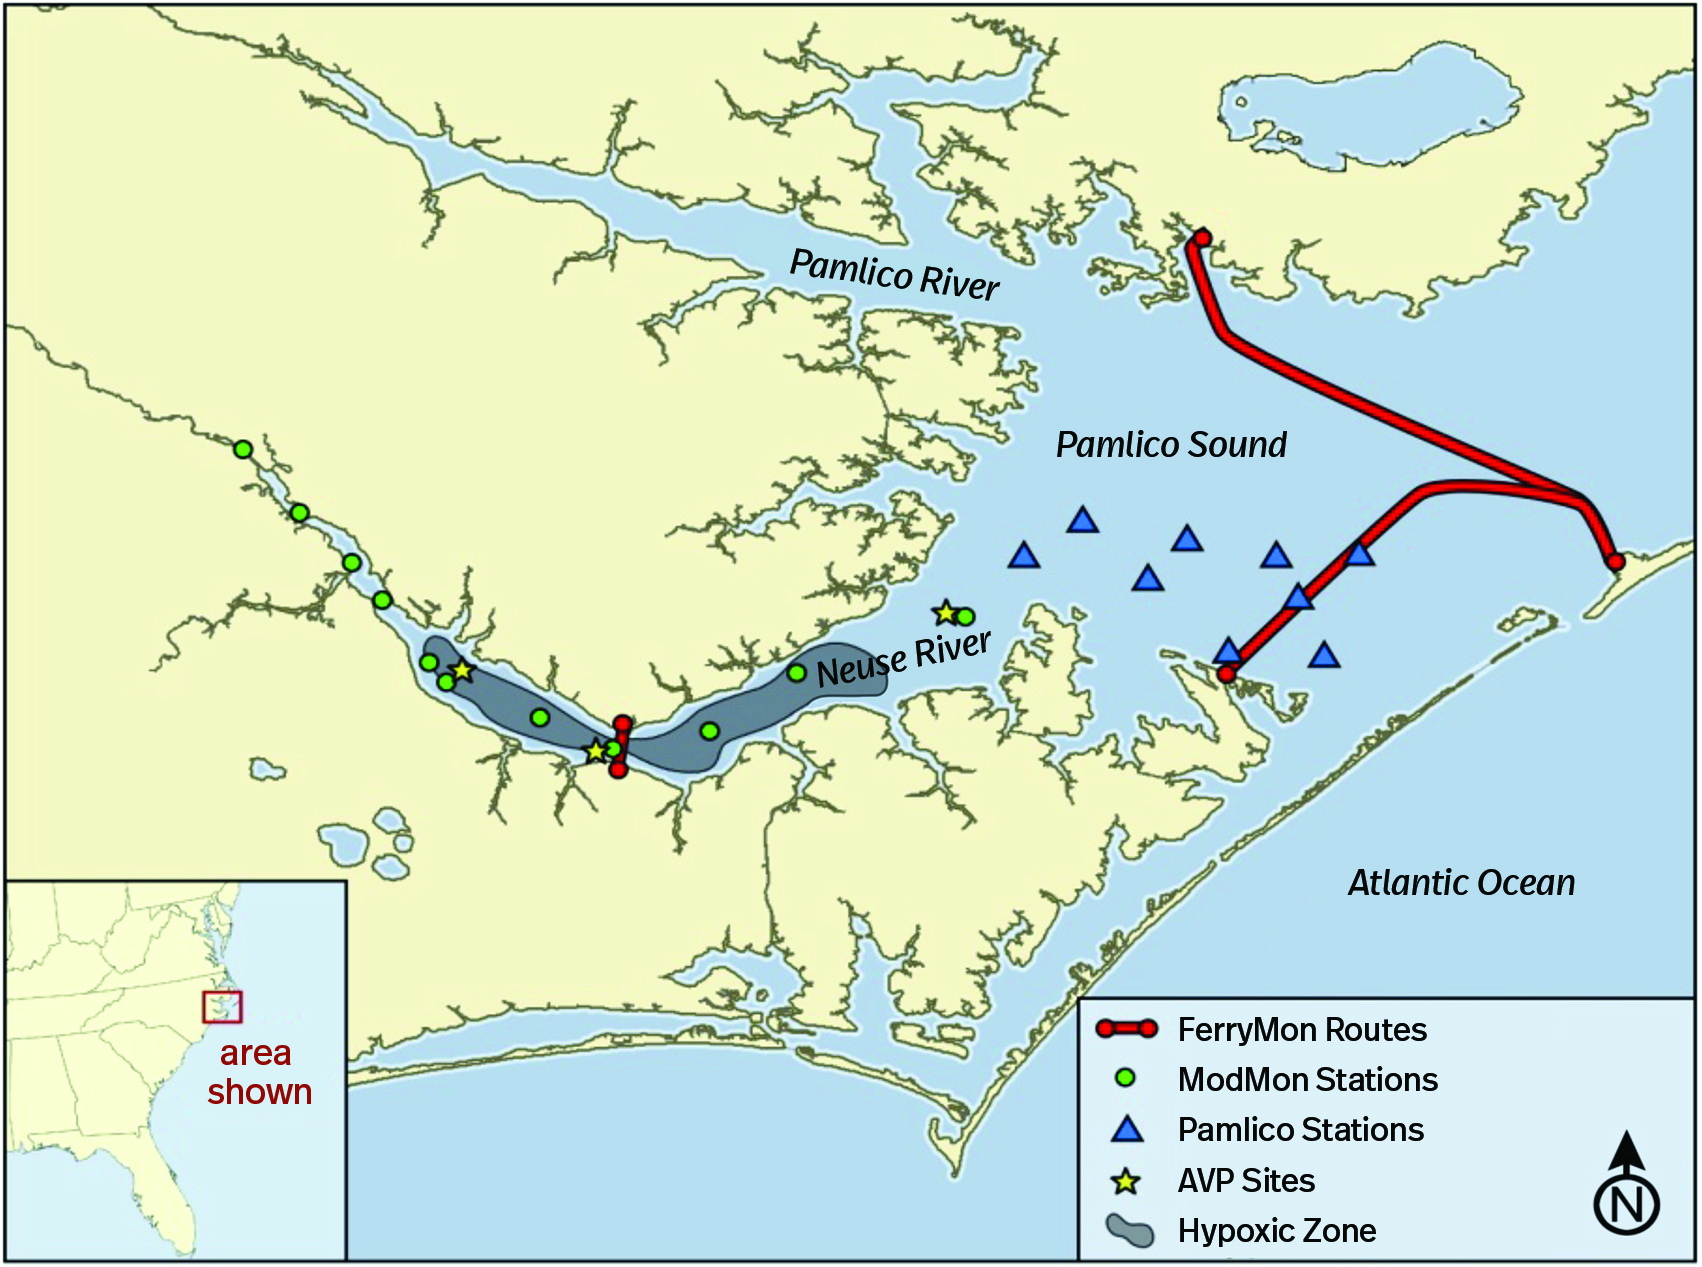
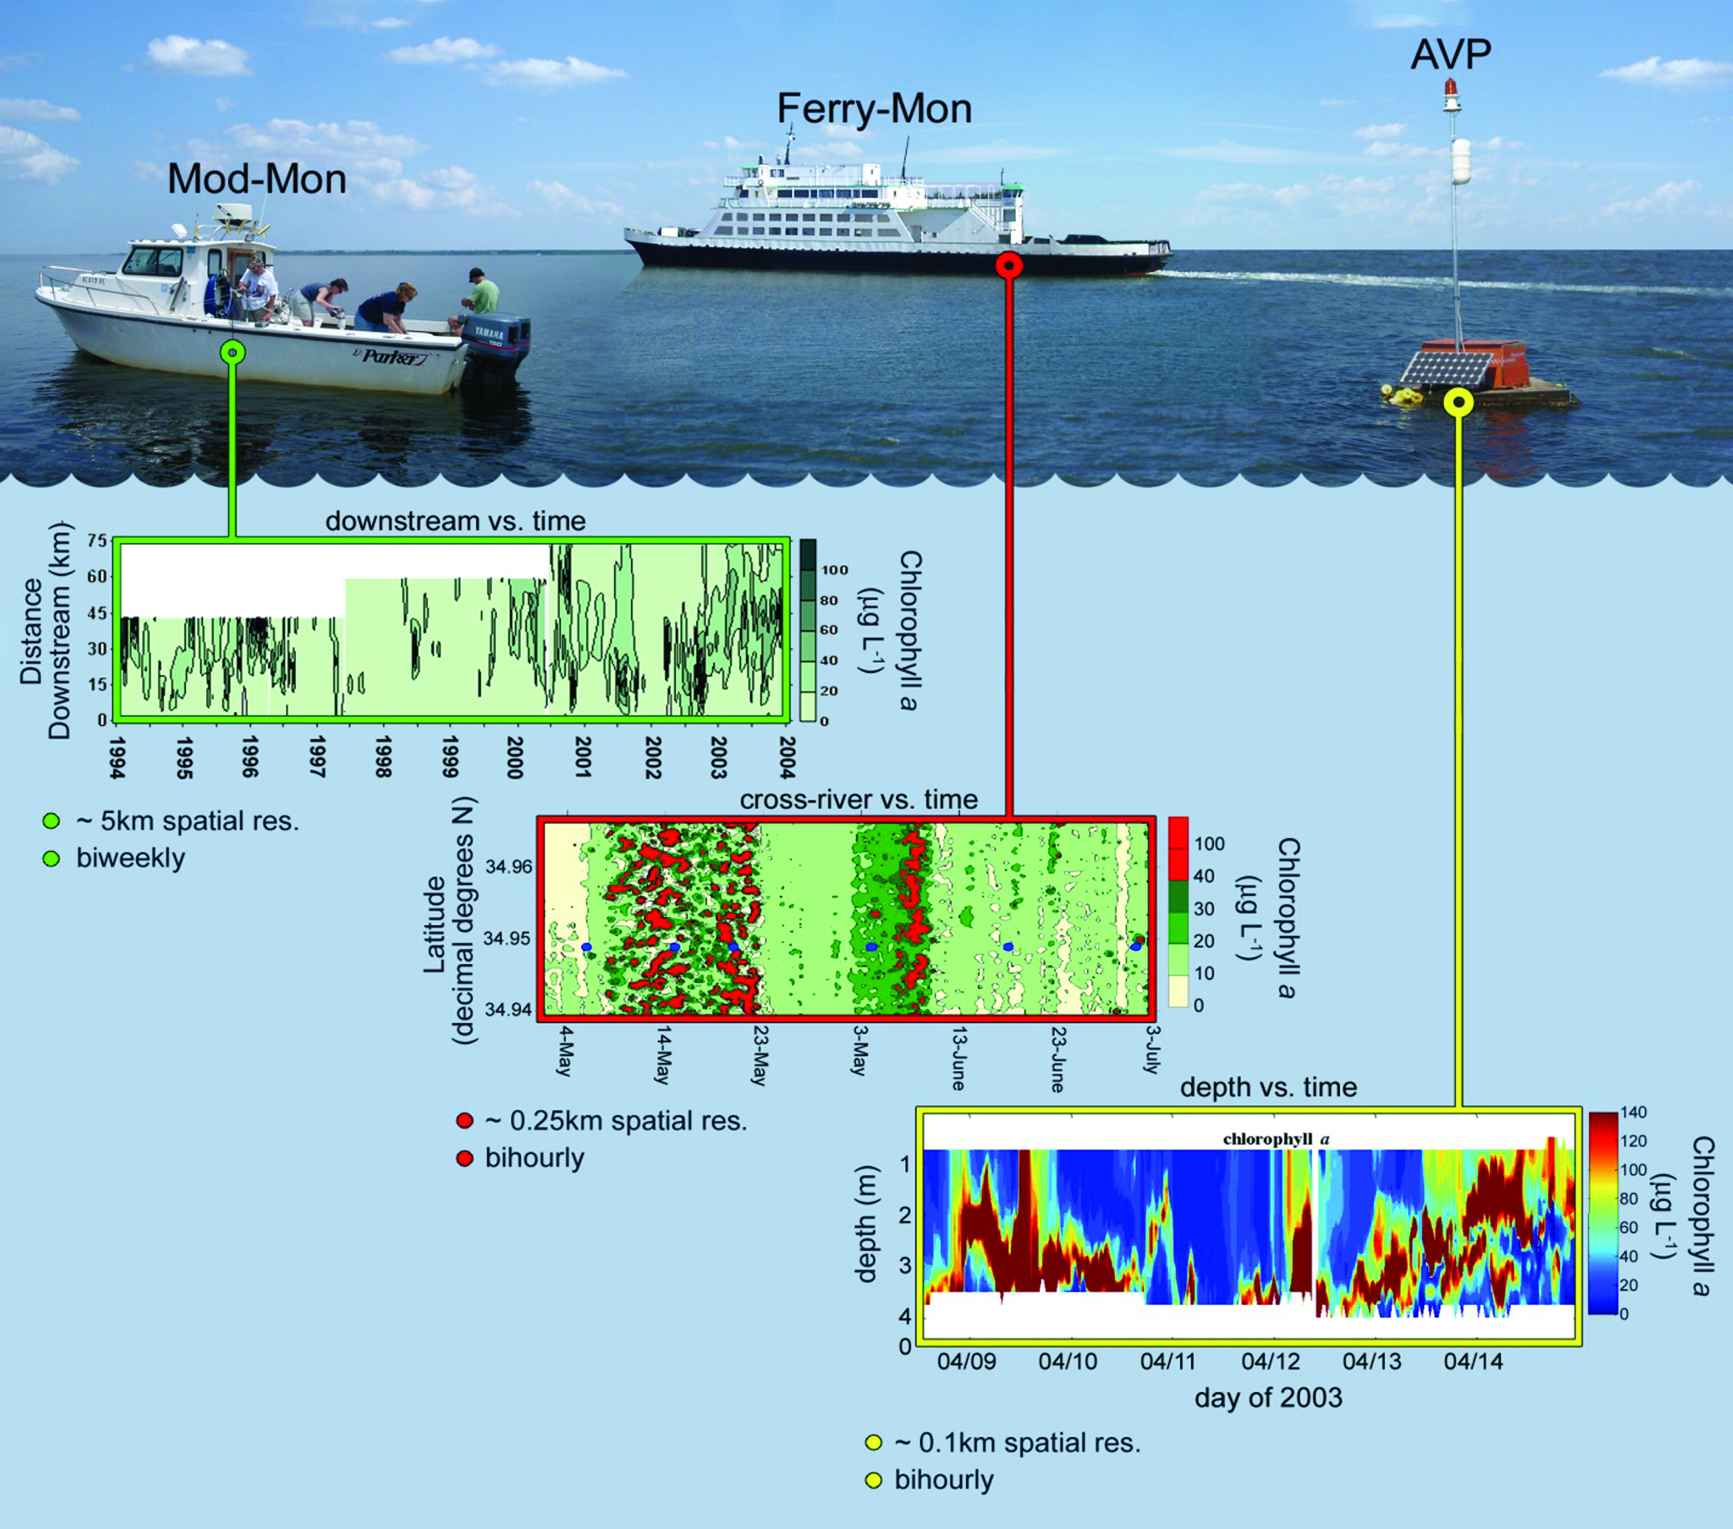
Researchers at the University of North Carolina’s Institute of Marine Sciences (UNC-IMS) continuously sample and evaluate the water in order to monitor the health of these important estuarine ecosystems using several long-term projects: the Neuse River Estuary Modeling and Monitoring Program (ModMon), since 1994; a ferry- based water quality monitoring program (FerryMon), since 2000; several autonomous vertical profilers (“AVPs”); and a set of monitoring stations on the Pamlico Sound. (See Figure 1 below.)
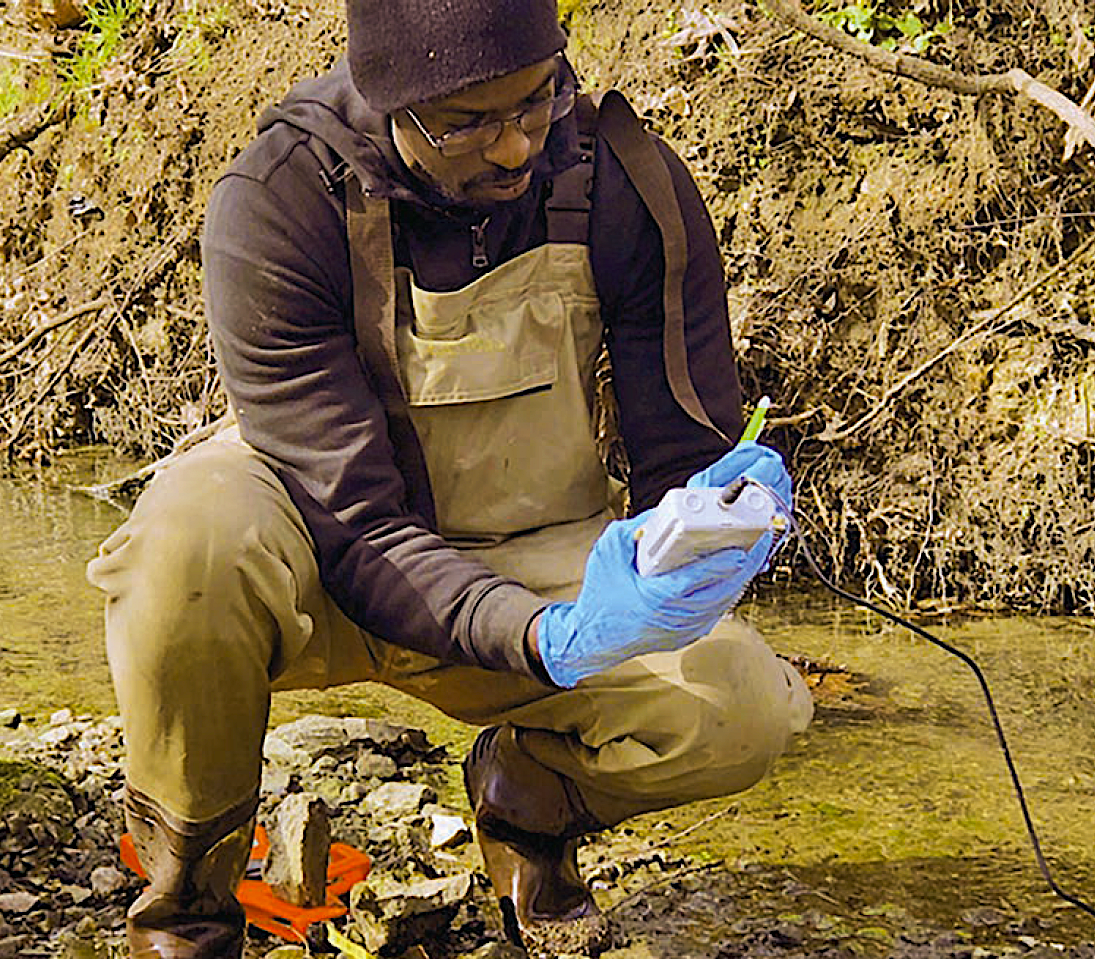
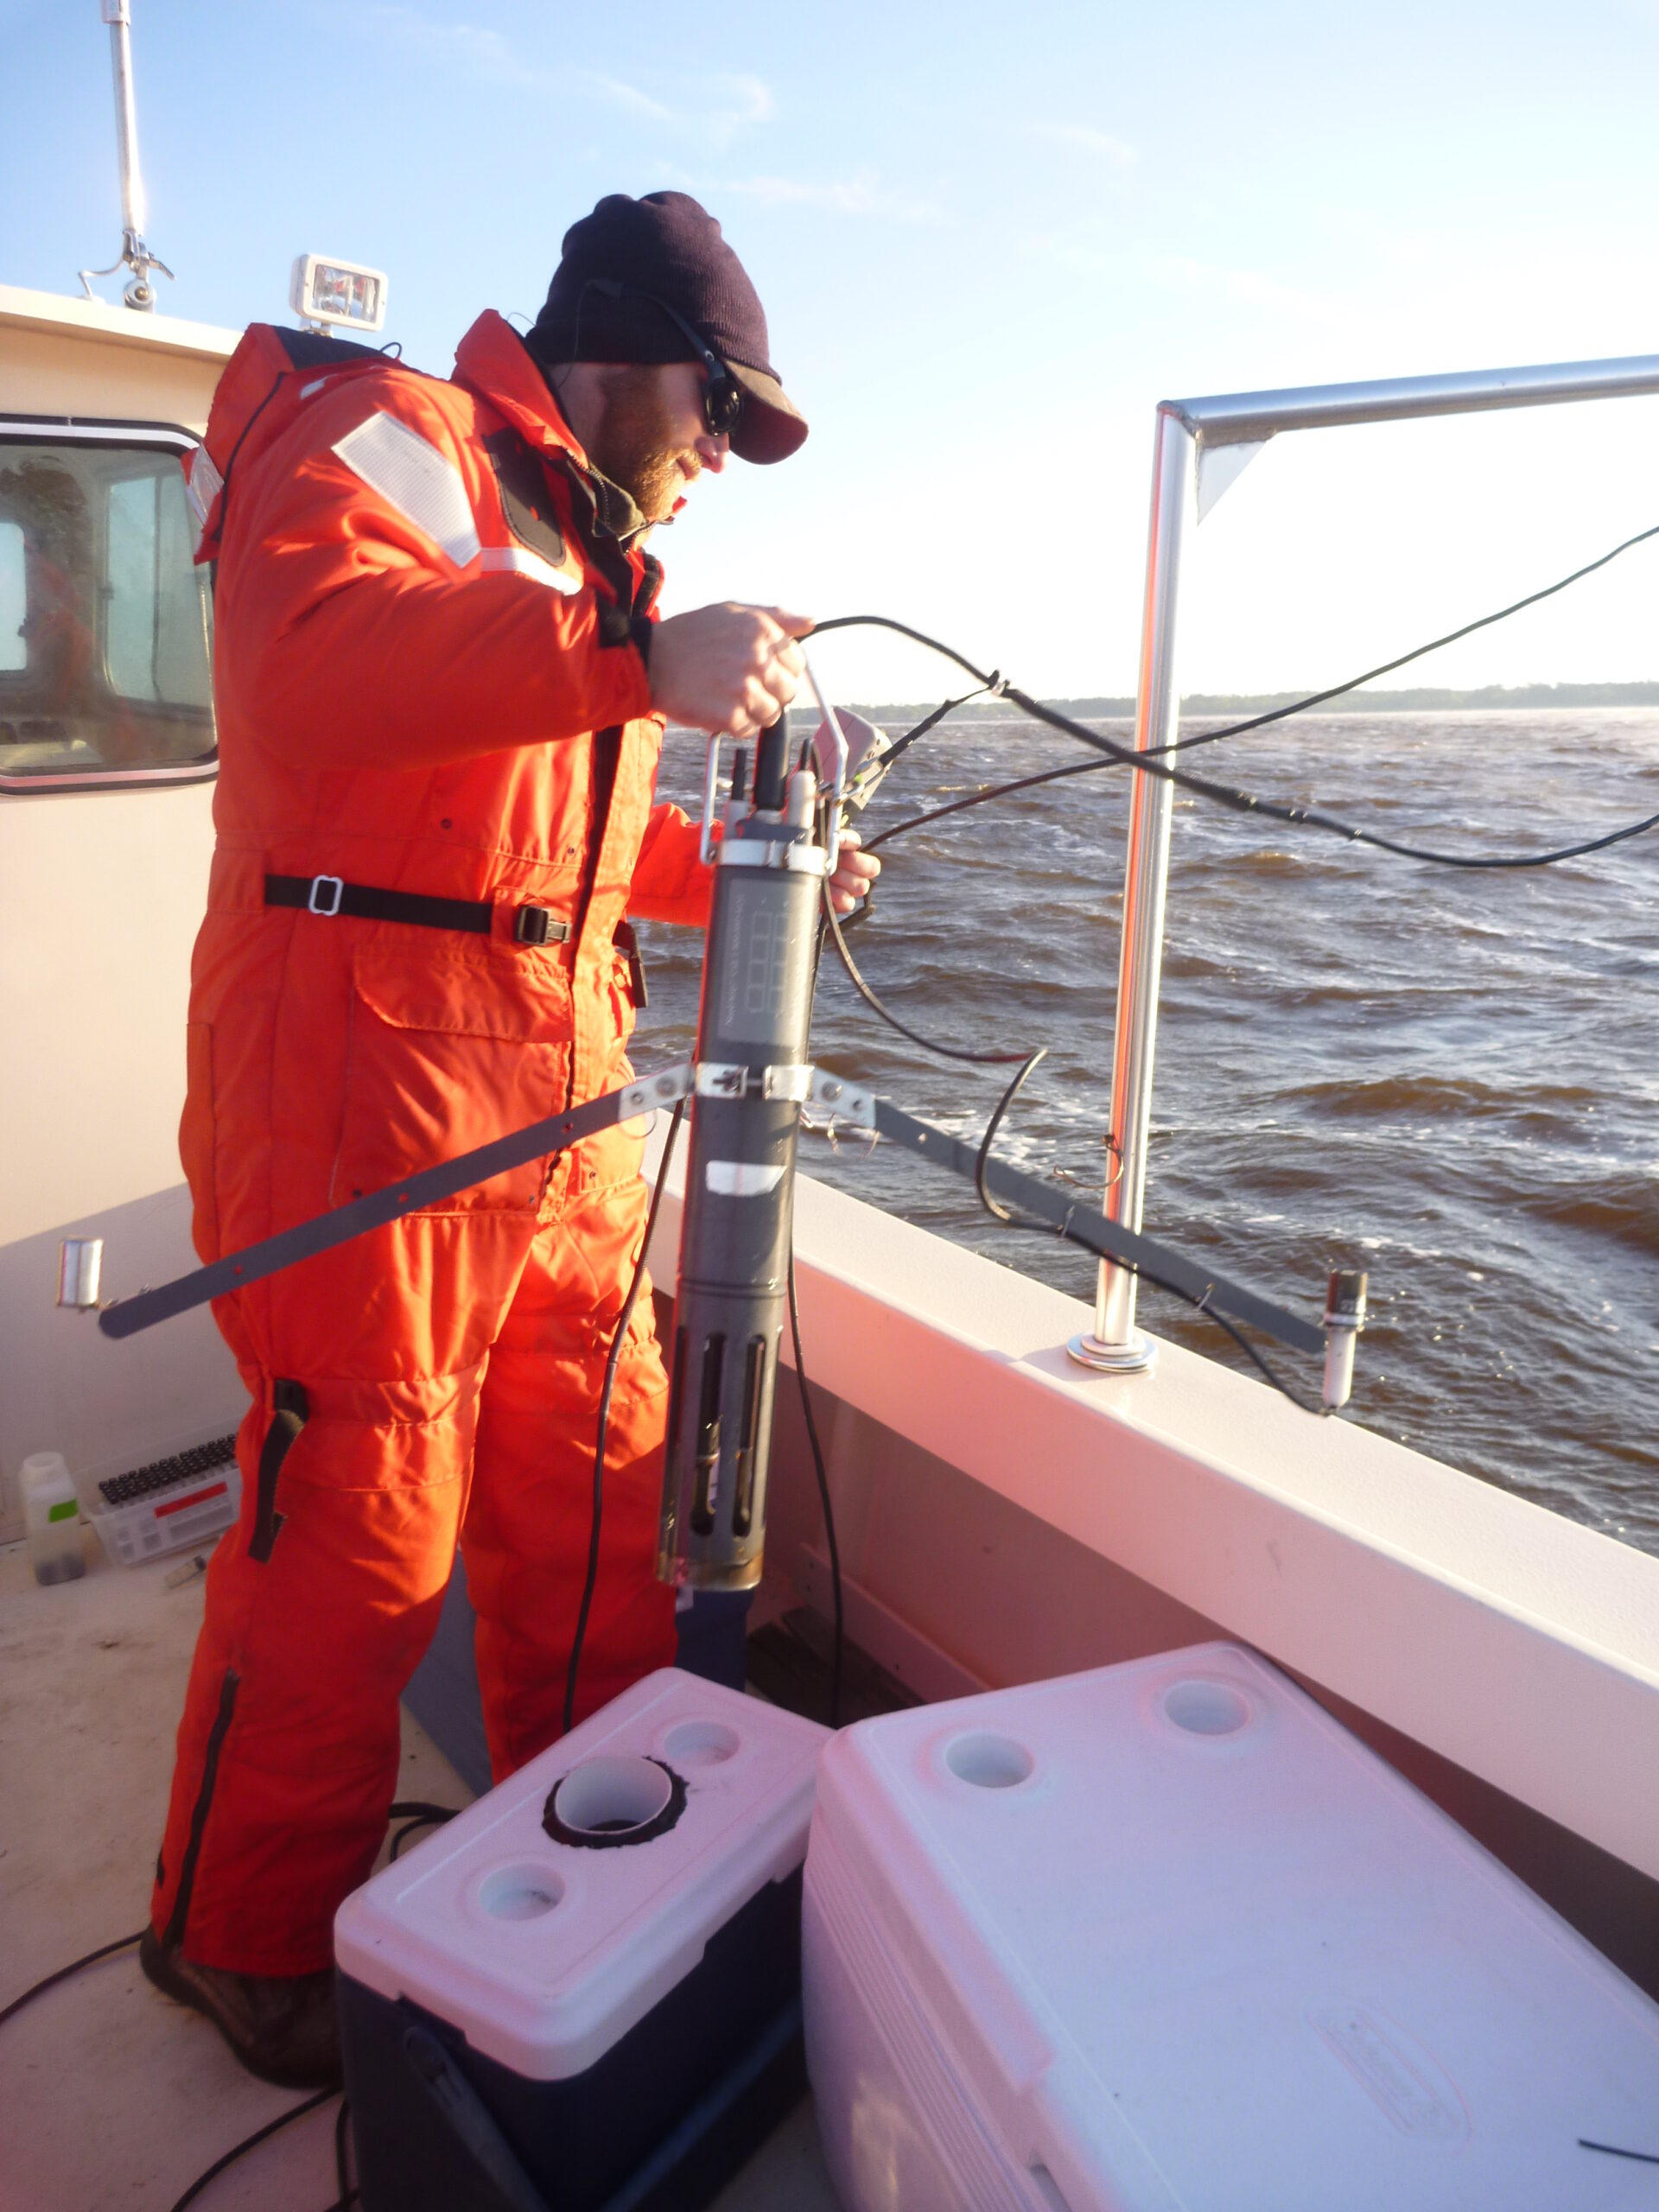
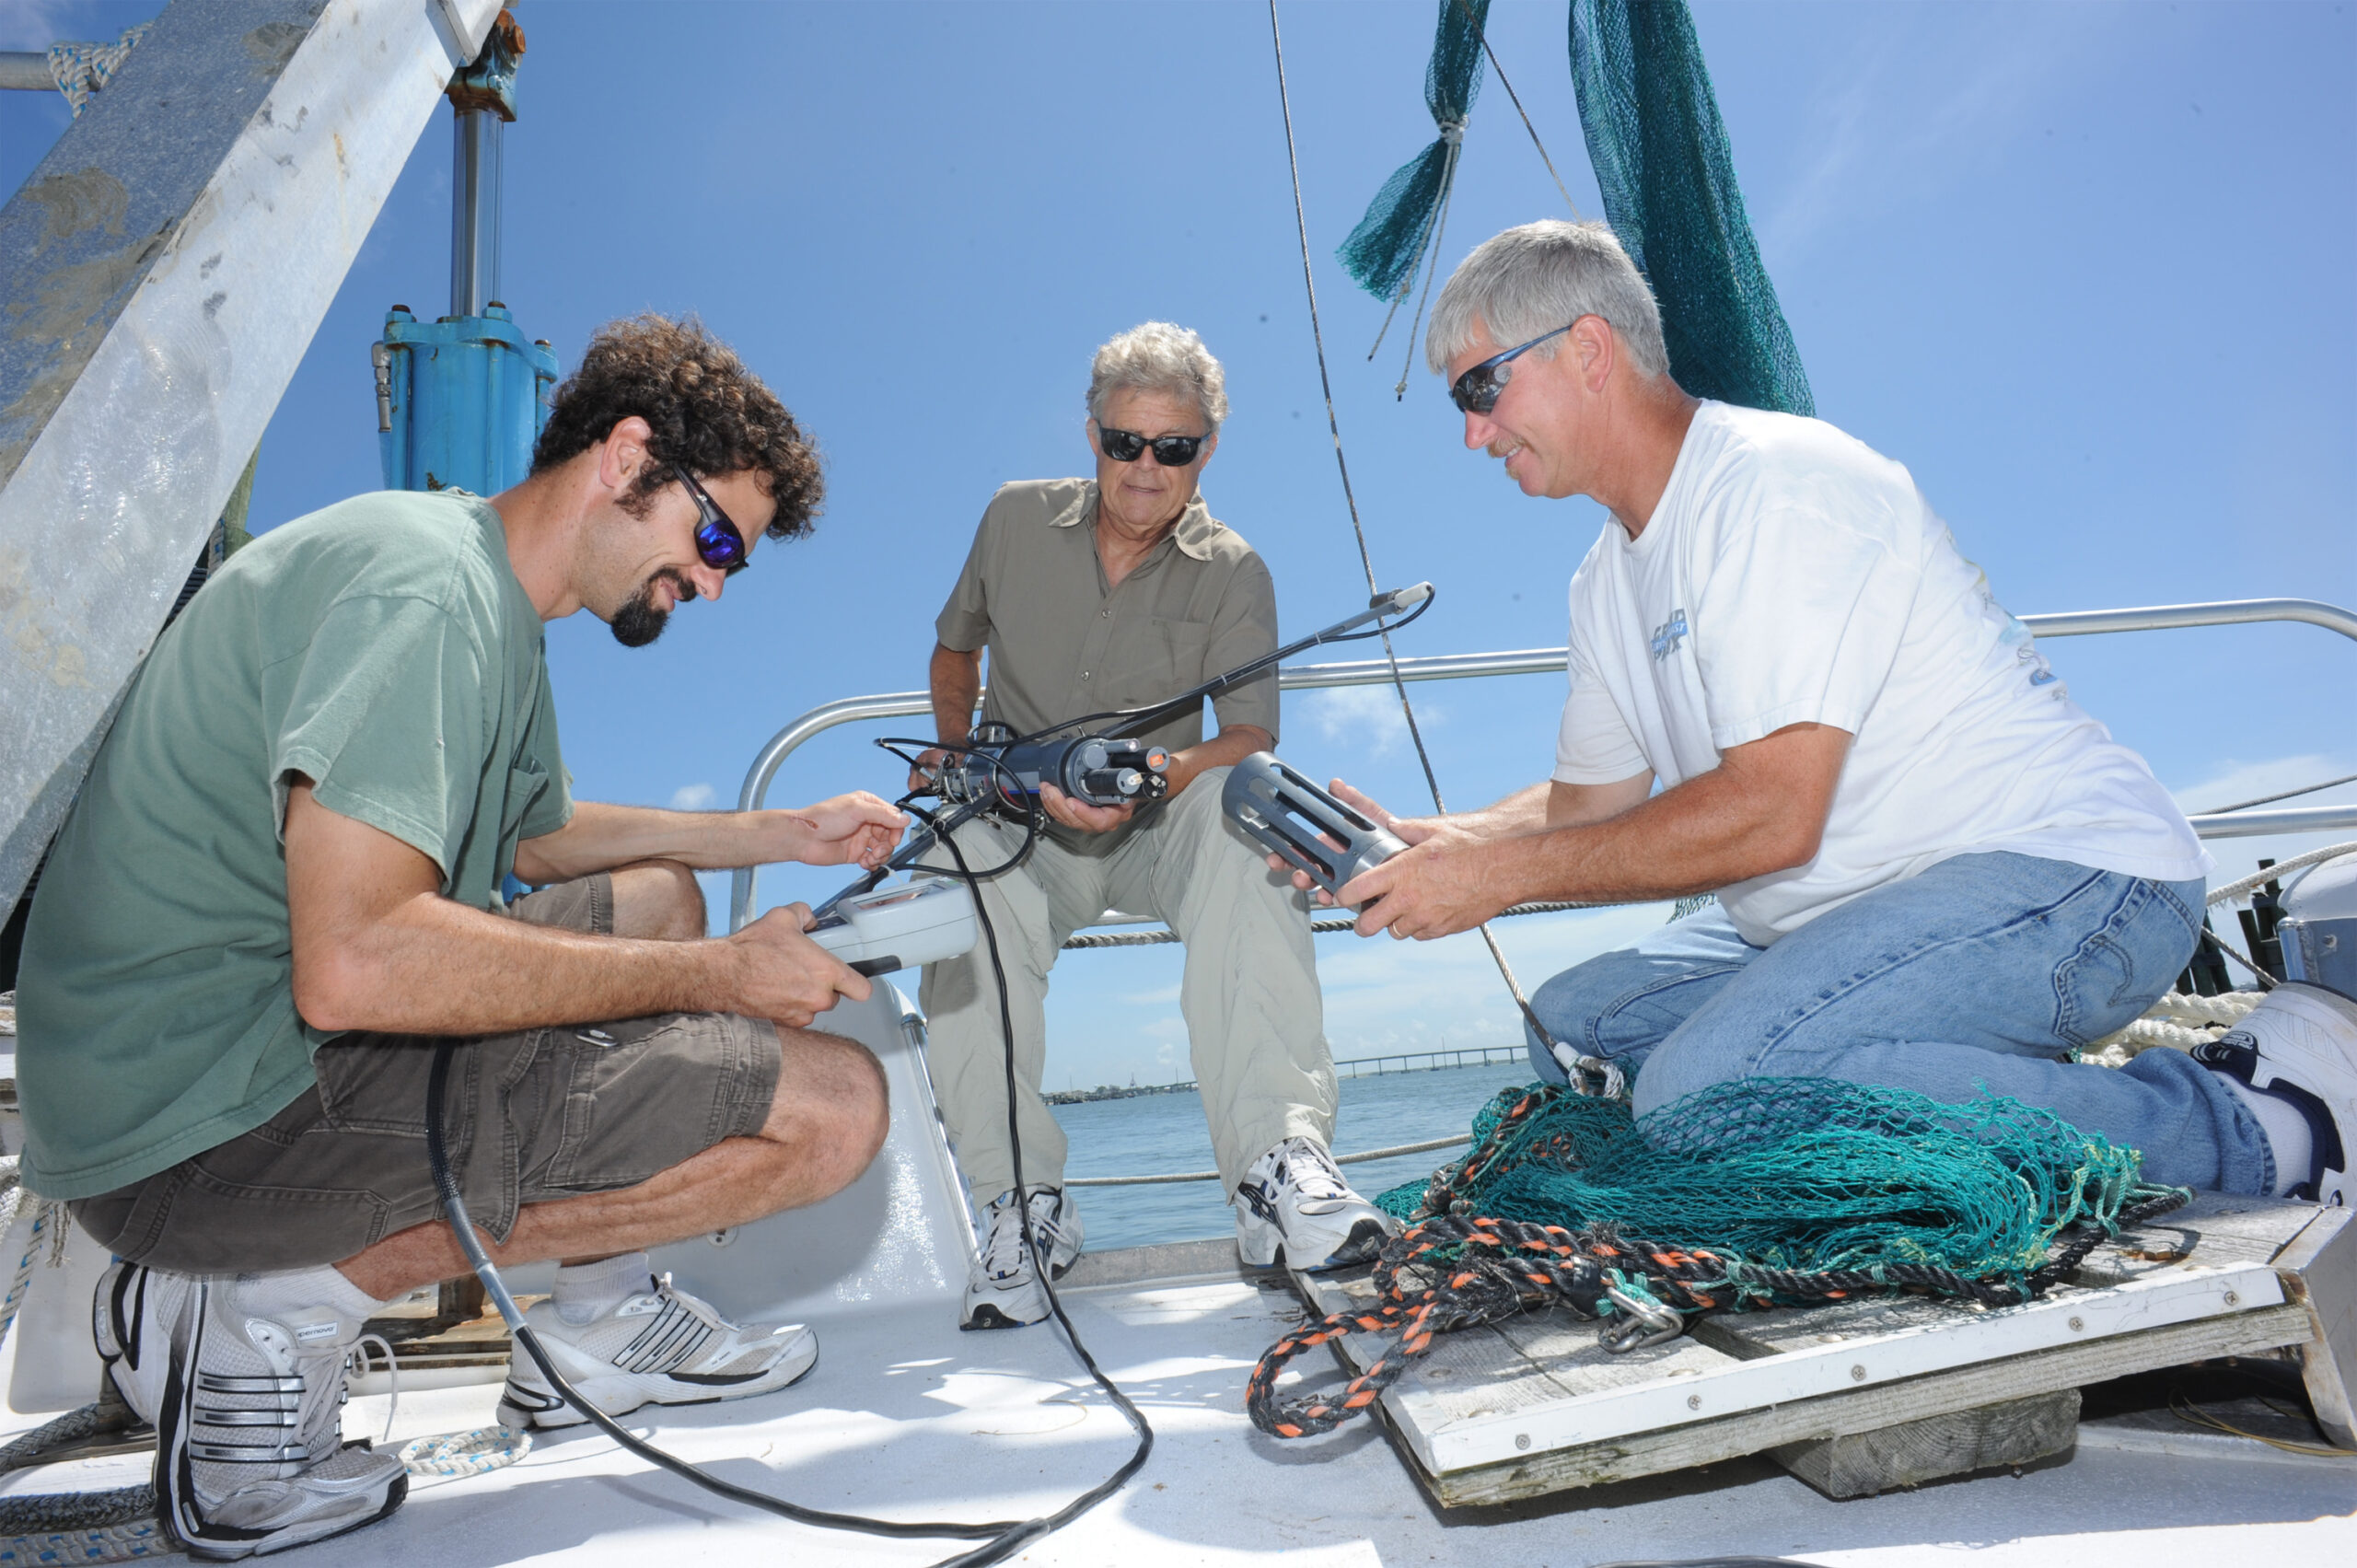
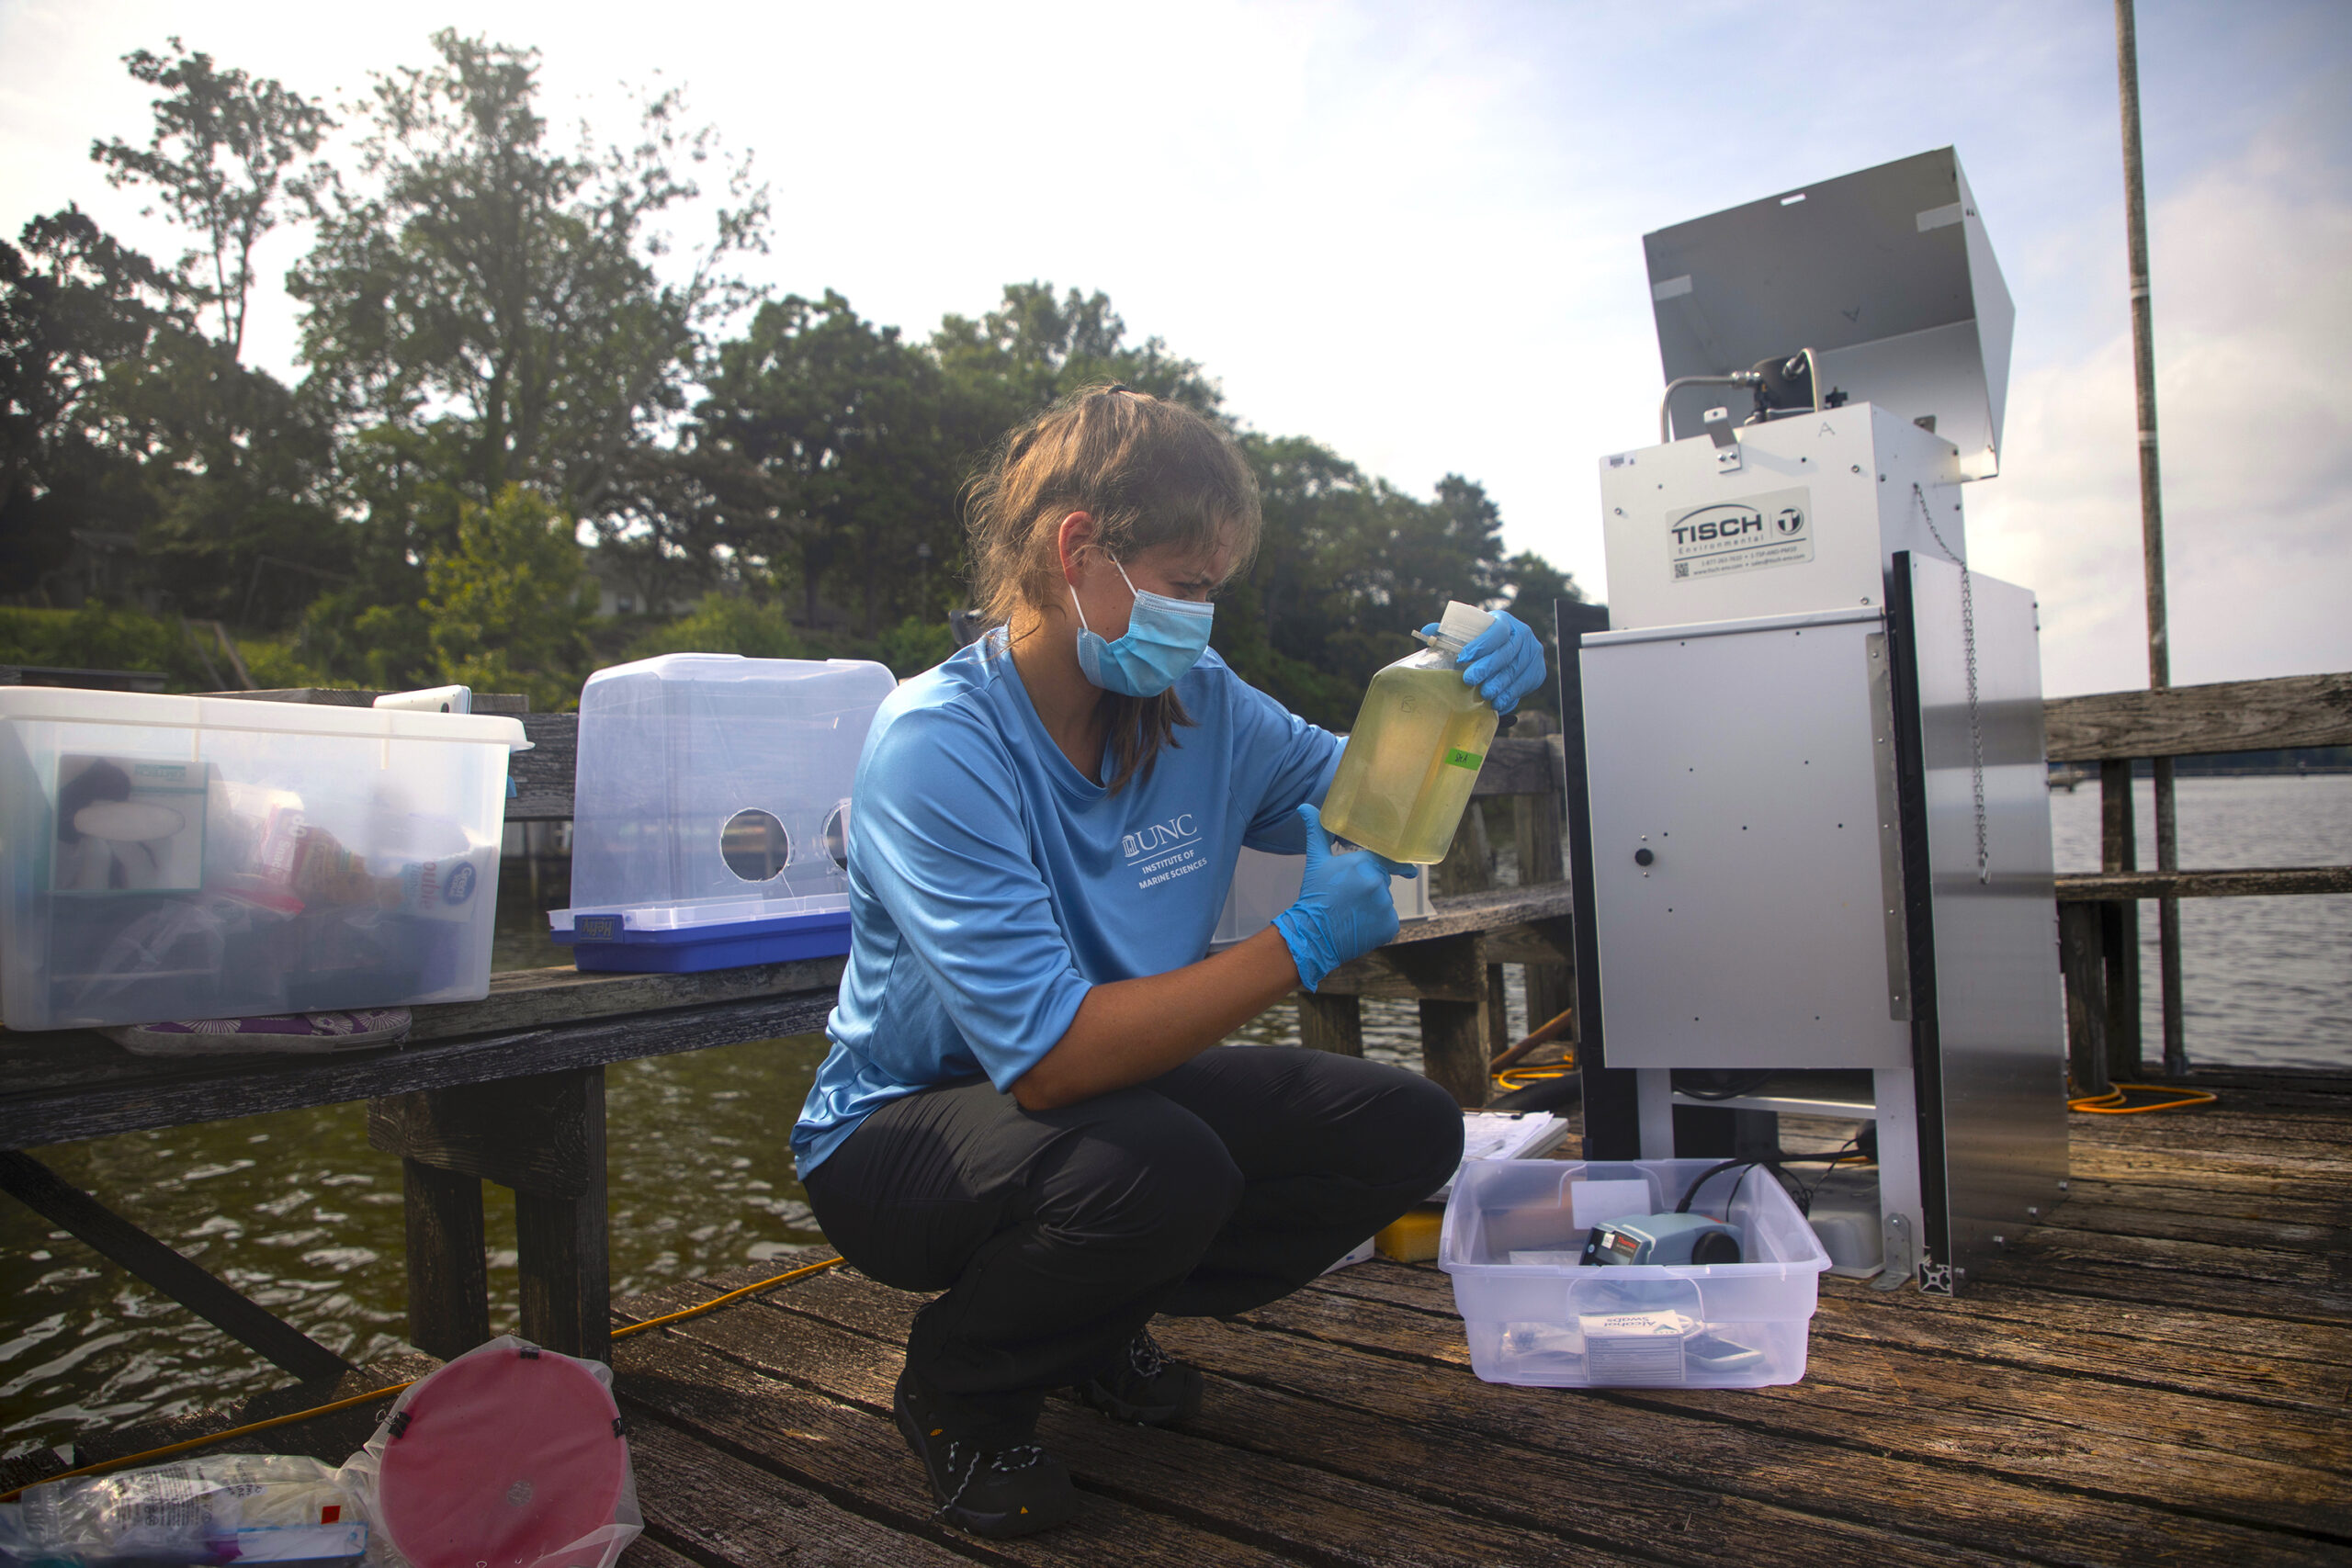
The ModMon program provides researchers with continuous information about the health of the estuary. ModMon has 11 sampling stations for assessing water quality that are located down the main channel of the Neuse River, from upstream above New Bern to the mouth, where it discharges into the Pamlico Sound. Twice a month, researchers visit each station by boat. Water quality conditions are first measured using a multisensor probe, or “sonde,” that is lowered down through the water column. Water samples are then collected near the surface and near the bottom from each station and brought back to the lab.
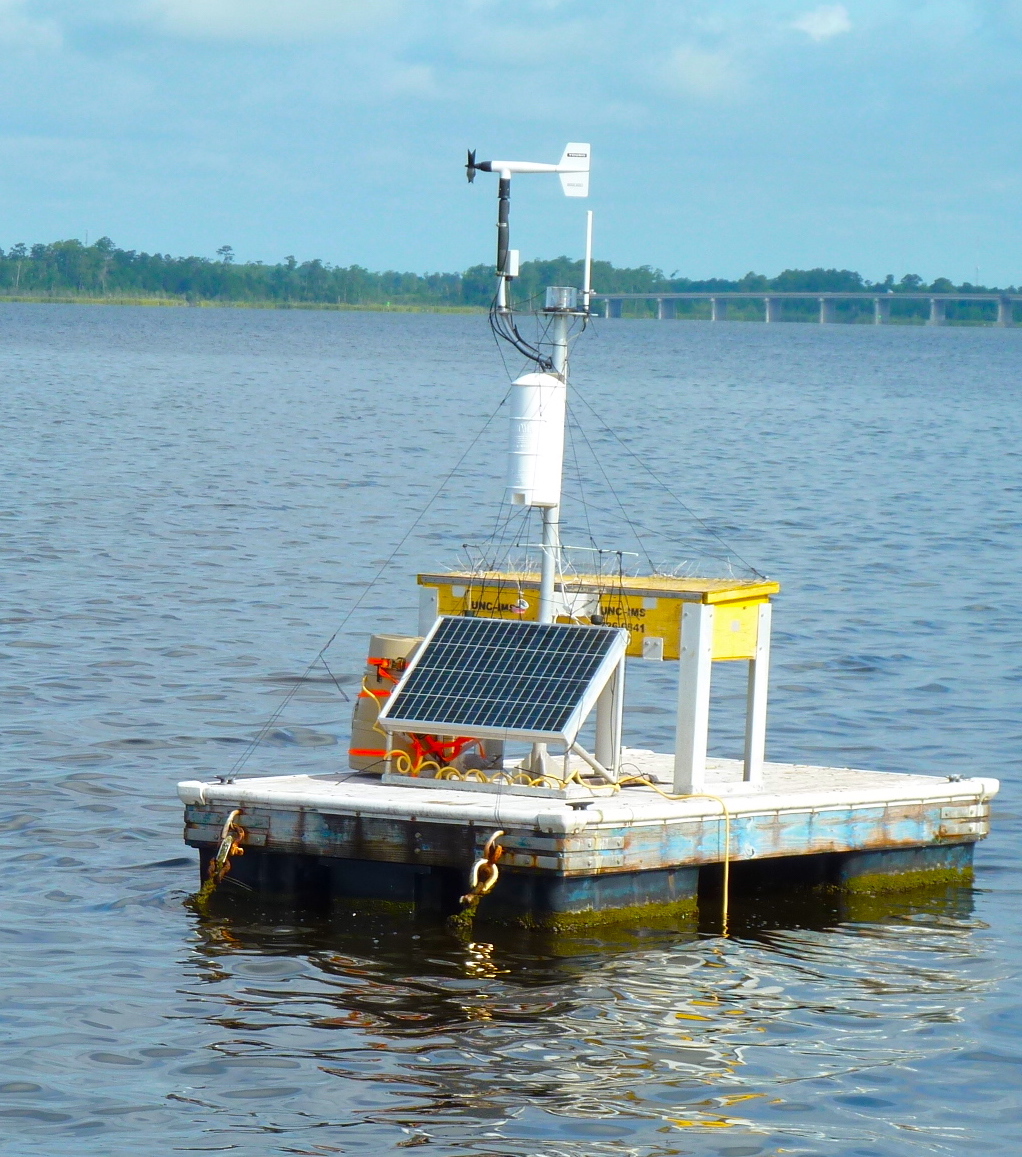
The ModMon program also uses AVPs to monitor strategic locations in the Neuse River. While the ModMon stations require a boat-based crew to perform the sampling, these buoy-based profilers are floating platforms that are continually on the water, automatically taking measurements of different parameters. This information is sent wirelessly from the AVPs to UNC-IMS in Morehead City.
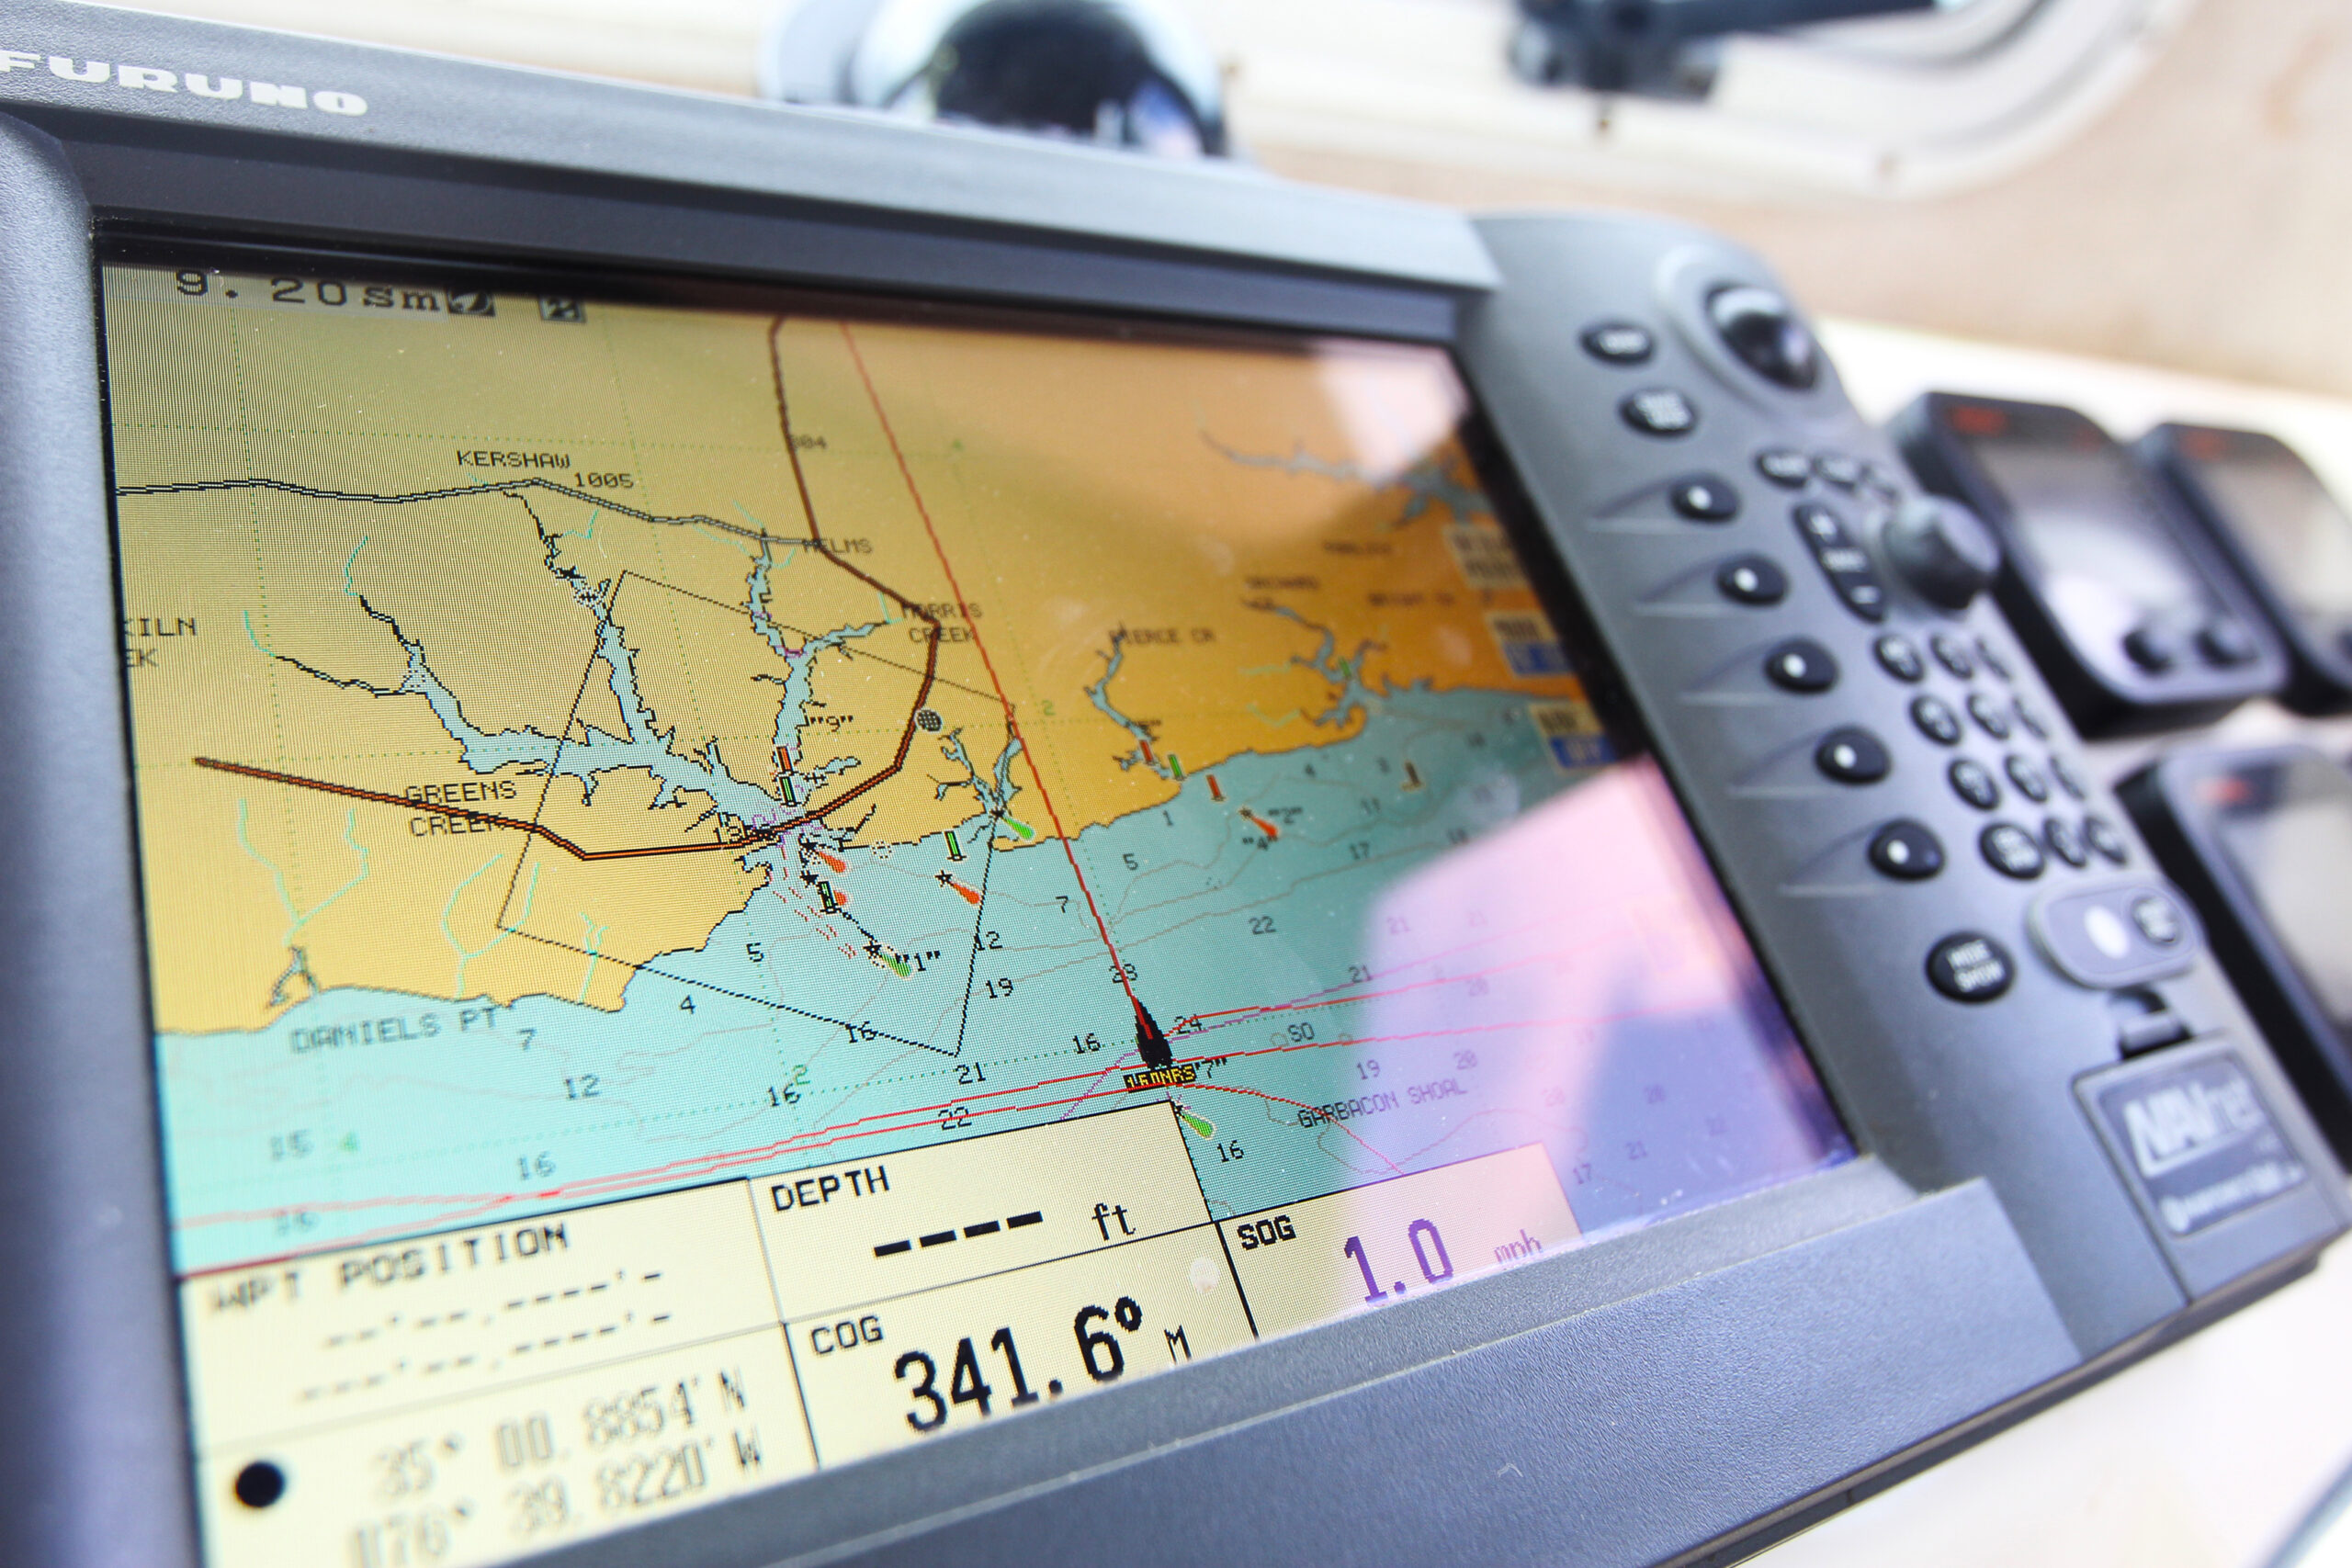
FerryMon also operates on the Neuse River and Pamlico Sound, enabling researchers to continually collect surface water quality data along the routes that the ferries travel. Data are linked to a GPS location, logged to an onboard computer, and sent via wireless connection to computer servers at UNC-IMS.
ModMon, FerryMon, and the AVPs all record water depth, light, temperature, dissolved oxygen, salinity, turbidity, chlorophyll fluorescence (as a measure of the amount of algae), and pH. Water samples are also collected from Pamlico and ModMon stations.
How We Use the Data
After the data are collected and processed, we can visualize the results as graphs and tables, which we then share with many different organizations, including state and federal governments, environmental and fisheries agencies, schools and universities, and other public and private groups. These include the North Carolina Department of Environmental Quality, the Division of Marine Fisheries, NOAA and the EPA, university researchers, stakeholder groups (such as the Neuse Basin Association and Neuse River Compliance Association), riverkeepers, and K-12 educators, as well as the public at large through the ModMon and FerryMon websites.
This information is vitally important for determining and evaluating the health of our estuarine water today and to evaluate changes in water quality over time, going back to the early 1990s.
ModMon’s data are used to evaluate the amount of nitrogen discharged into the water, which is essential to understand in order to control eutrophication (the unfettered growth of algae) and harmful algal blooms, as well as hypoxia (excessive oxygen consumption).
These data also are used to evaluate alternatives for reducing nitrogen loading as specified by the North Carolina legislature and to calibrate and validate several predictive water quality models that then help test the effectiveness of limits on nitrogen discharge to our local waters.
In addition, ModMon and FerryMon data are used to calibrate various satellite-based and aircraft-based remote-sensing systems, enabling us to scale up views of water quality conditions across the entire Albemarle-Pamlico Sound system.
Last, data from ModMon and FerryMon also allow us to observe the effects of storms, hurricanes, and nutrient and pollution discharges on the environment, as well as to create a means to monitor water quality over a longer period of time. Most importantly, data collected from this network of monitoring programs help scientists learn what affects water quality on the coast of North Carolina. These are essential ingredients for long-term environmental management and protection of the Albemarle-Pamlico Sound’s precious resources.
What We Measure and Why
To determine water quality, we collect data on physical, chemical, and biological factors.
Nutrients
Nutrients like nitrogen and phosphorus are essential for supporting the growth of phytoplankton, the floating microscopic algae that form the base of estuarine and coastal food chains. We can measure nutrient concentrations either directly with sensors or through laboratory chemical techniques.
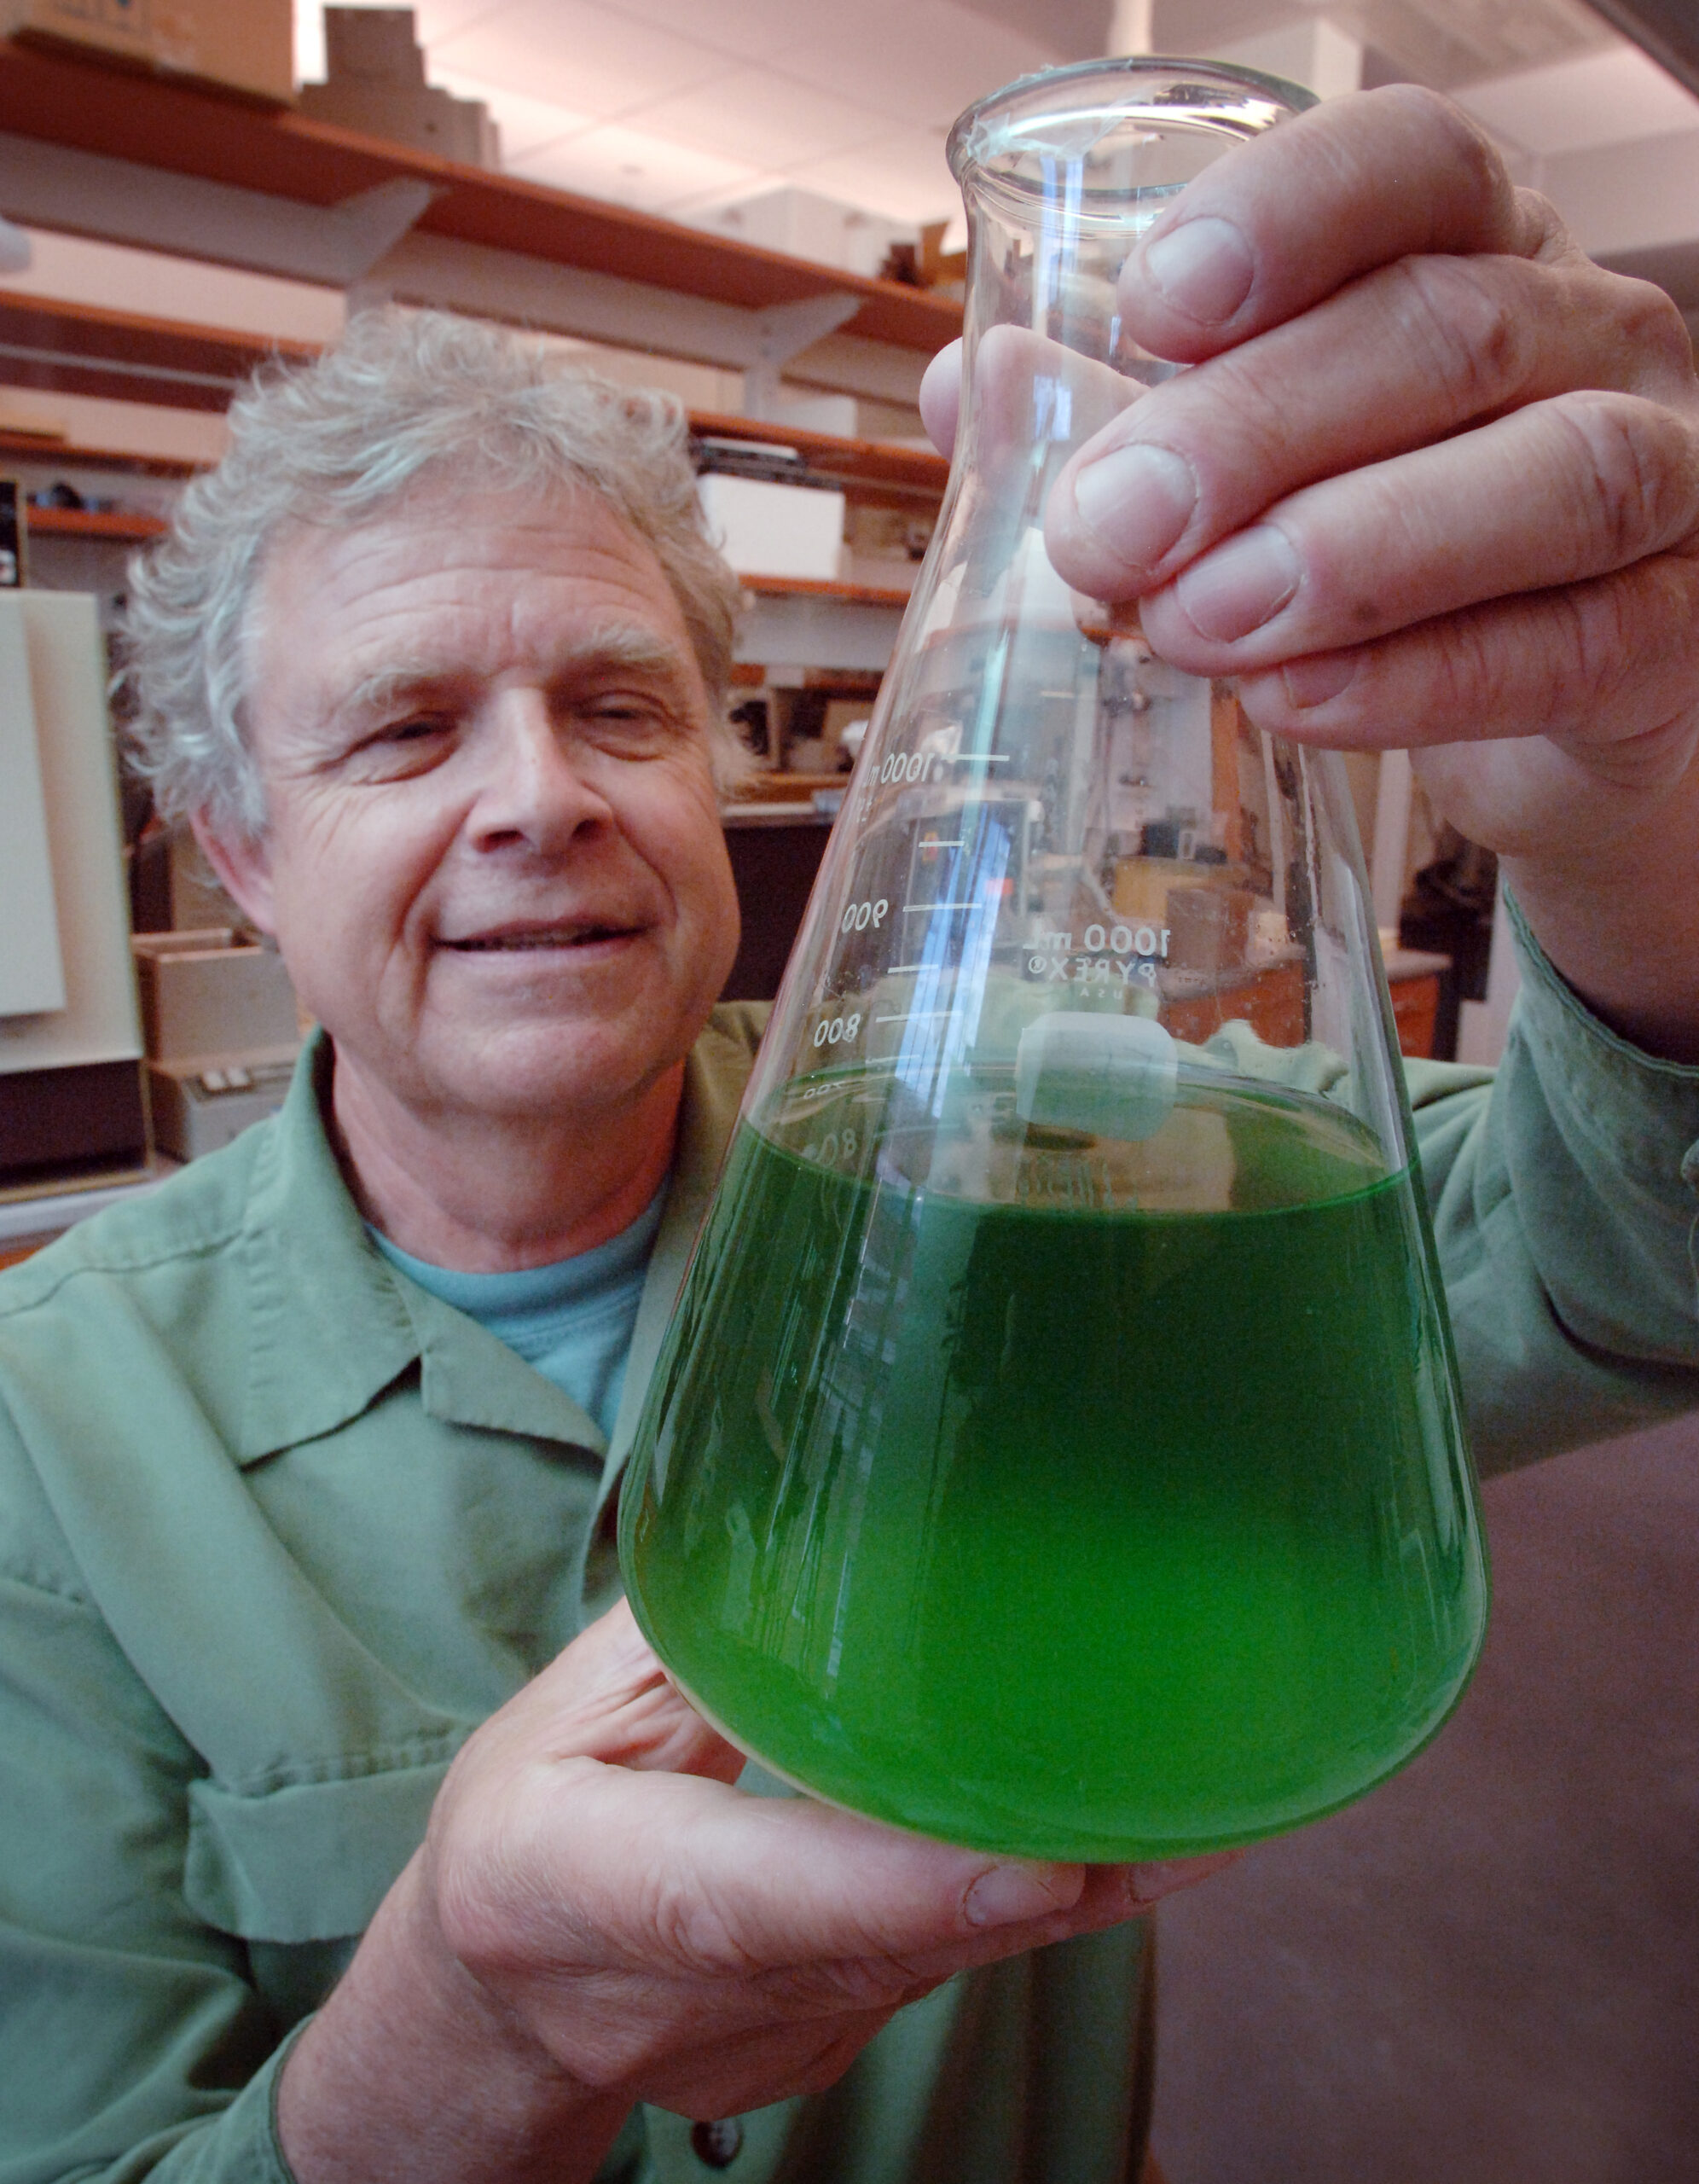
High nutrient concentrations can at times cause uncontrolled growth of algae, seen as distinct greening of the water column. These algae “blooms” sometimes even become toxic to many organisms, including fish and humans. When blooms sink and die, the water at the bottom of the estuary starts to run out of oxygen, which severely stresses and kills shellfish and finfish trapped in those zones.
What causes high nutrient concentrations? Human activities create nutrient sources that either discharge directly or wash into the estuary when it rains: fertilizer runoff from farmland, waste from animal operations, discharge from septic systems, urban stormwater runoff, sediment loss from exposed and eroded soils, and discharge from industries and wastewater treatment plants. All of these contribute to excessive algae growth.
Chlorophyll
Plants, including algae, use the green pigment chlorophyll to trap energy from the sun and convert it to chemical energy for growth in the process of photosynthesis. Chlorophyll is measured by fluorescence, using sensors in the water or by extracting the pigments from samples. Chlorophyll tells us how much algae is in the water.
Temperature and Dissolved Oxygen
All plants, animals, bacteria, and algae prefer specific temperature ranges, and most grow faster in warmer waters. The temperatures in the Neuse River and Pamlico Sound usually range from about 43°F to 86°F. Warm water holds less oxygen than cold water, so waters are more likely to have dangerously low levels of oxygen during the summer months. If oxygen concentrations get too low, some of the animals and plants in the water can die.
pH
Parts hydrogen, or pH, is a measure of how acidic or basic the water is. On a scale of 0 to 14, the majority of aquatic animals need a range of 6.5 to 8.5 to survive. Low pH can make toxic compounds in the water, like heavy metals, more available to marine organisms, creating harmful conditions for aquatic life. Some mollusks have trouble making their shells under such acidic conditions.
pH can be affected by pollutants entering the water from acid rainfall, runoff, and surface and groundwater discharge. Also, increasing atmospheric levels of the greenhouse gas carbon dioxide (CO2) in turn can lead to more CO2 in fresh and marine waters, which then lowers their pH. Rising CO2 emissions from the burning of fossil fuels, therefore, contributes both to global warming and ocean acidification.
Salinity
Plants, animals, bacteria, and algae have certain salinity ranges in which they can grow and survive best, and, thus, sudden changes in salt content can kill an organism. The salinity in the Neuse River and Pamlico Sound can range from 0 to 30 parts per thousand. Fresh water is less dense than salty sea water, so when a surge of fresh water from the Neuse River enters the saltier Pamlico Sound, the lighter fresh water sits on the surface, while the denser, heavier salt water stays on the bottom.
Turbidity
Turbidity is a measure of water transparency. Organic and inorganic solid matter can become suspended in the water, causing the water to look cloudy. This can prevent sunlight from reaching aquatic plants that need light for growth. In the Neuse River, high turbidity is often caused by high wind, high flow rate, stormwater runoff that contains floating sediment, and algal blooms. Colored, dissolved organic matter — like when fallen leaves from trees turn river water brown — may also block sunlight.
How You Can Help
You can participate in water quality monitoring for the Neuse River Estuary and Pamlico Sound. We would love to include your data to help monitor the health of the estuary.
To begin, order a test kit. You can find kit instructions and video tutorials here.
With this kit, you will be able to collect data on temperature, dissolved oxygen, pH, and turbidity. If possible, return periodically to sample and monitor how the water quality changes over time at any of a series of shore-based sites along the Neuse River complementing our ModMon sampling sites.
Public access locations along the Neuse River, starting upstream in New Bern and ending downstream in Oriental, include:
- Boat Ramp dock at Glenburnie Park in New Bern (N35°8.383, W 77°3.592).
- Boat Ramp dock at Union Point Park in New Bern (N 35°6.292, W 77°2.084).
- Neuse River/Flanners Beach Recreation Area (N 34°59.065, W 76°56.931).
- Pine Cliff Recreation Area in Havelock (N 34°56.361, W 76°49.322) Note: When exiting Pine Cliff Recreation Area, take a left onto Ferry Road. Drive to the end of the road to take the ferry across the Neuse River to Minnesott Beach to continue to the next sampling location.
- Janiero Road in Arapahoe (N 34°59.572, W 76°45.403).
- South Avenue in Oriental (N 35°1.479, W 76°41.509).

As a reward for your hard work, be sure to sample some ice cream at The Bean in Oriental before you return home.
Once you have collected data, you can upload the information here. You also can compare your data to ModMon and FerryMon data at the project websites.
And consider monitoring other bodies of water for which you have an interest or concern.
FerryMon
paerllab.web.unc.edu/projects/ferrymon/
ModMon
paerllab.web.unc.edu/projects/modmon/
The Paerl Lab
paerllab.web.unc.edu/
FerryMon started with support from North Carolina Sea Grant and the N.C. Hurricane Floyd Relief Fund. The N.C. General Assembly, the National Fish and Wildlife Foundation, the Duke Energy Water Resources Fund, The Reynolds Foundation, the National Science Foundation, and the N.C. Water Resources Research Institute have funded it since then. Over the years, several North Carolina Sea Grant projects also have relied on data from ModMon.
REFERENCES
Burgess, Carla, ed. Neuse River Basin. Raleigh: North Carolina Department of Environment and Natural Resources, 2013.
Paerl, H.W., K.L. Rossignol, N.S. Hall, R. Guajardo, A.R. Joyner, B.L. Peierls, and J. Ramus. 2009. FerryMon: Ferry-based monitoring and assessment of human and climatically-driven environmental change in the Pamlico Sound System, North Carolina, USA. Environmental Science and Technology 43:7609-7613.
Powell, Chris. Neuse: The Fight for the River of Peace. Wildlife in North Carolina. Raleigh: North Carolina Wildlife Resources Commission, 1999.
Access the PDF version of this article.
Supplemental content for grade 6-12 educators accompanies this article.