Vital Signs
NOAA’s Global Climate Report

Last year brought unprecedented high temperatures and numerous severe weather events.
In November, NOAA issued a report regarding 2024’s global climate anomalies. The report details temperatures, rainfall, and catastrophic weather events, as well as how measures compare historically. Of particular note, all continents experienced record-high average temperatures for the January–November period in 2024, except for Asia, which experienced its second highest.
A November to Remember
November 2024’s average global surface temperature was 2.41°F above the global 20th-century average, which makes it the second-warmest November on record. Furthermore, about 10.6% of the world’s surface, including both land and sea, experienced record-high November temperatures, a higher percentage than any other month.
According to NOAA’s report, 0.4% of the world experienced record-low temperatures, a decrease from 2023’s 0.5%. High temperatures particularly affected the Arctic and northern Asia, with some individual measurements reaching over 10.8°F above the November average. Pakistan reported an outlying November temperature of 5.20°F above its 1991–2020 average, making it Pakistan’s warmest November on record.
Fall 2024
The September–November seasonal global temperatures were the second-warmest on record at 2.36°F above the 20th-century average.
Several areas around the world experienced their warmest seasonal average temperatures to date, such as the contiguous U.S. (4.1°F higher than the 20th-century average), the Caribbean (+2.77°F), Australia (+3.74°F), and Japan (+3.55°F). Several areas, such as the Gulf of Mexico and Hong Kong, set new records for their warmest fall season.
A large section of global sea temperatures also reached record-high or higher-than-average temperatures, spanning from the Caribbean to the northeast Indian Ocean.
Temperatures for the Year
Average global January-November temperatures were at an all-time high of 2.3°F above the 1901–2000 average of 57.2°F.
Sea surface temperatures were more varied, with tropical and subtropical climates experiencing record-high or above-average temperatures and higher latitudes experiencing near-average or below-average temperatures.
All continents had record-high average temperatures for the January-November period, except for Asia, which had its second-highest. North America is particularly notable in this regard, with the contiguous United States and the Caribbean experiencing record-high temperatures of 3.31°F and 2.05°F above average.
Storms and Extreme Weather
In November, Storm Bert brought heavy winds, rain, and snow to south Wales and southwest England, causing hundreds of property floods and a number of deaths. (Incidentally, Hurricane Rafael tied 1985’s Hurricane Kate as the strongest November hurricane in the Gulf of Mexico on record.)
Tropical cyclones Yinxing, Toraji, and Man-yi hit Hong Kong successively, requiring three warnings in November for the first time since 1946. Cyclonic Storm Fengal caused flooding and landslides in India and Sri Lanka, which led to over two dozen deaths. Super Typhoon Usagi in the Philippines marked an unprecedented fourth simultaneous western Pacific cyclone in November.
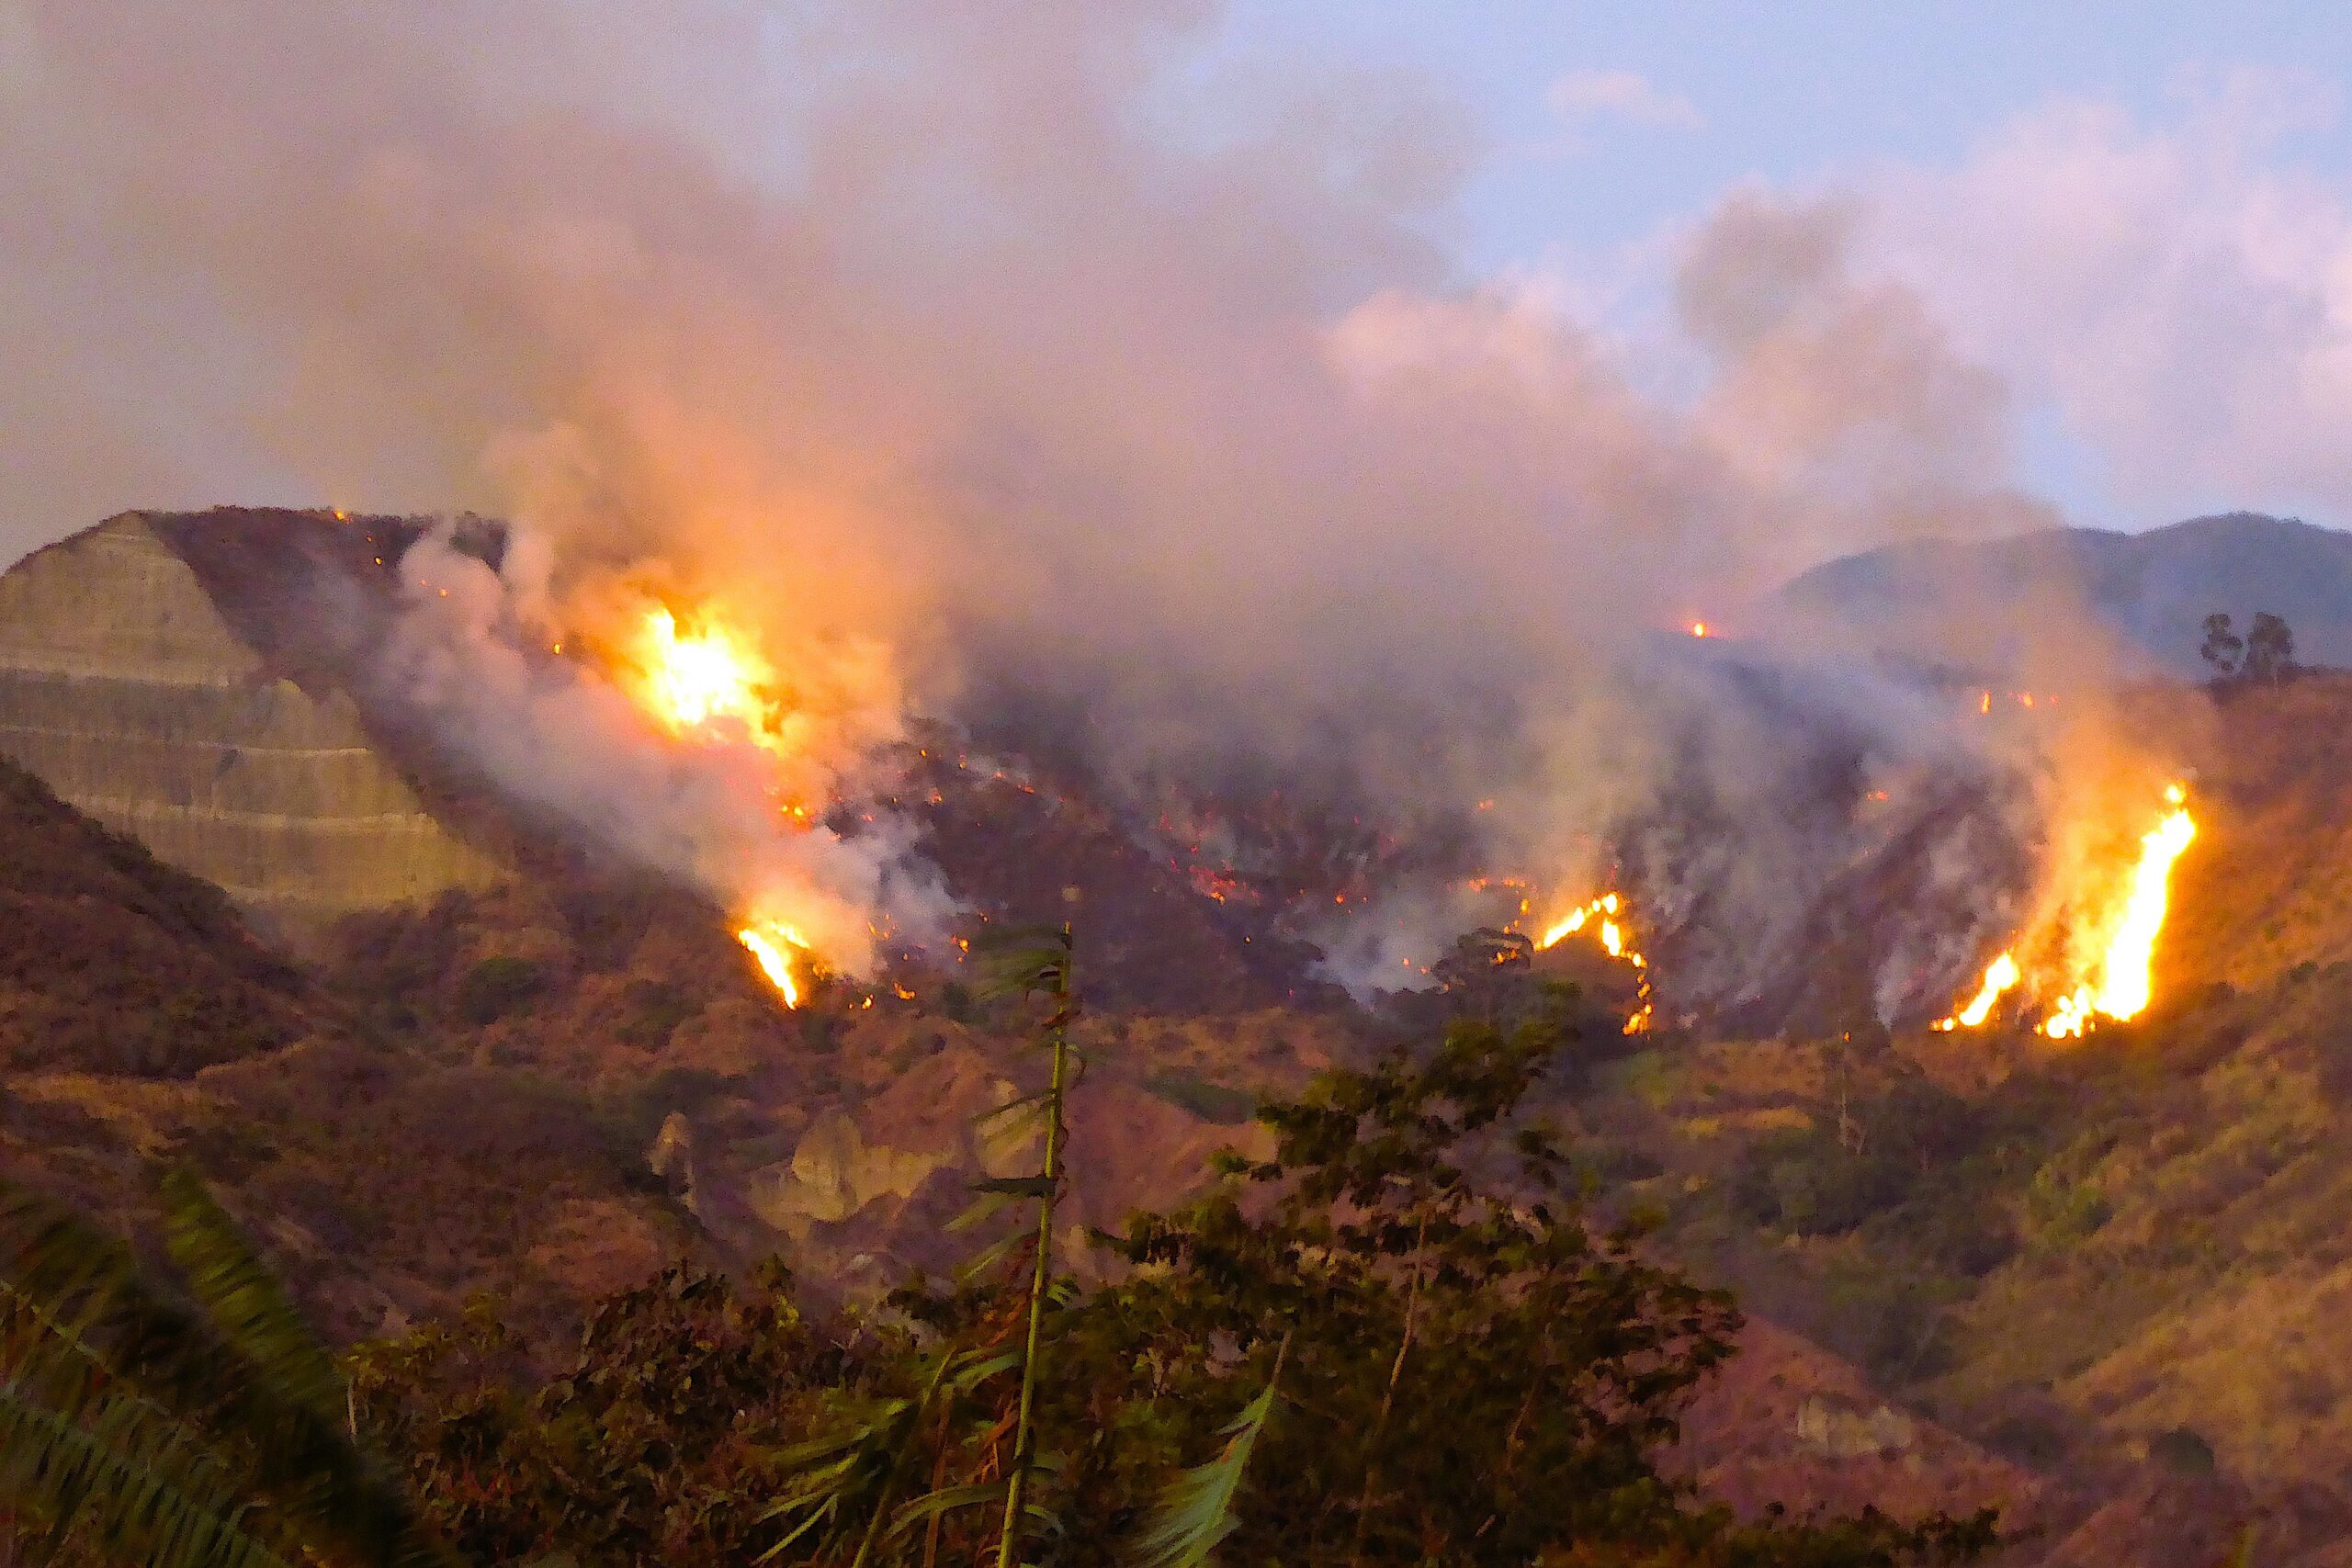
Other parts of the world experienced drought conditions, which caused water and crop crises. In South America, severe drought caused wildfires in Bolivia, Nicaragua, and the Pantanal wetlands. Drought in Brazil caused coffee crop production failure, which contributed to a rise in global prices by up to 80%. And an ongoing drought in Sicily has created the greatest water crisis in its history, with the island nearing desertification.
the full report
NOAA Global Climate Report 2024
MORE
The Catastrophic Power of Hurricane Helene
Early Warnings: Satellite Imagery May Help Protect Coastal Forests from Climate Change
Mind the Gap: Findings from the UN’s 2024 Emissions Gap Report
North Carolina’s True Ghost Story: A Tale of Carbon, Salt, and Sea Level Rise
Ice to Ocean: From the Sources of Sea Level Rise to the Coast of NC
More from Coastwatch on climate change
Ruthie Froning is a contributing editor for Coastwatch and a science communication intern with North Carolina Sea Grant. She is pursuing a master’s degree in linguistics at NC State University.
lead photo: NOAA.
- Categories: