The Art and Science of Weather
Constant fluctuation is part of coastal life. To work and recreate safely, we need to be able to predict the weather.
The official Atlantic hurricane season runs from June 1 to November 30 — a season notorious for extreme weather.
I have stood in my yard as the eye of a hurricane passed over. First, raging wind and dark skies abruptly shifted to eerie stillness and a bright pop of sunlight. Then clouds returned, and the wind slammed back as the hurricane presented the second half of the show.
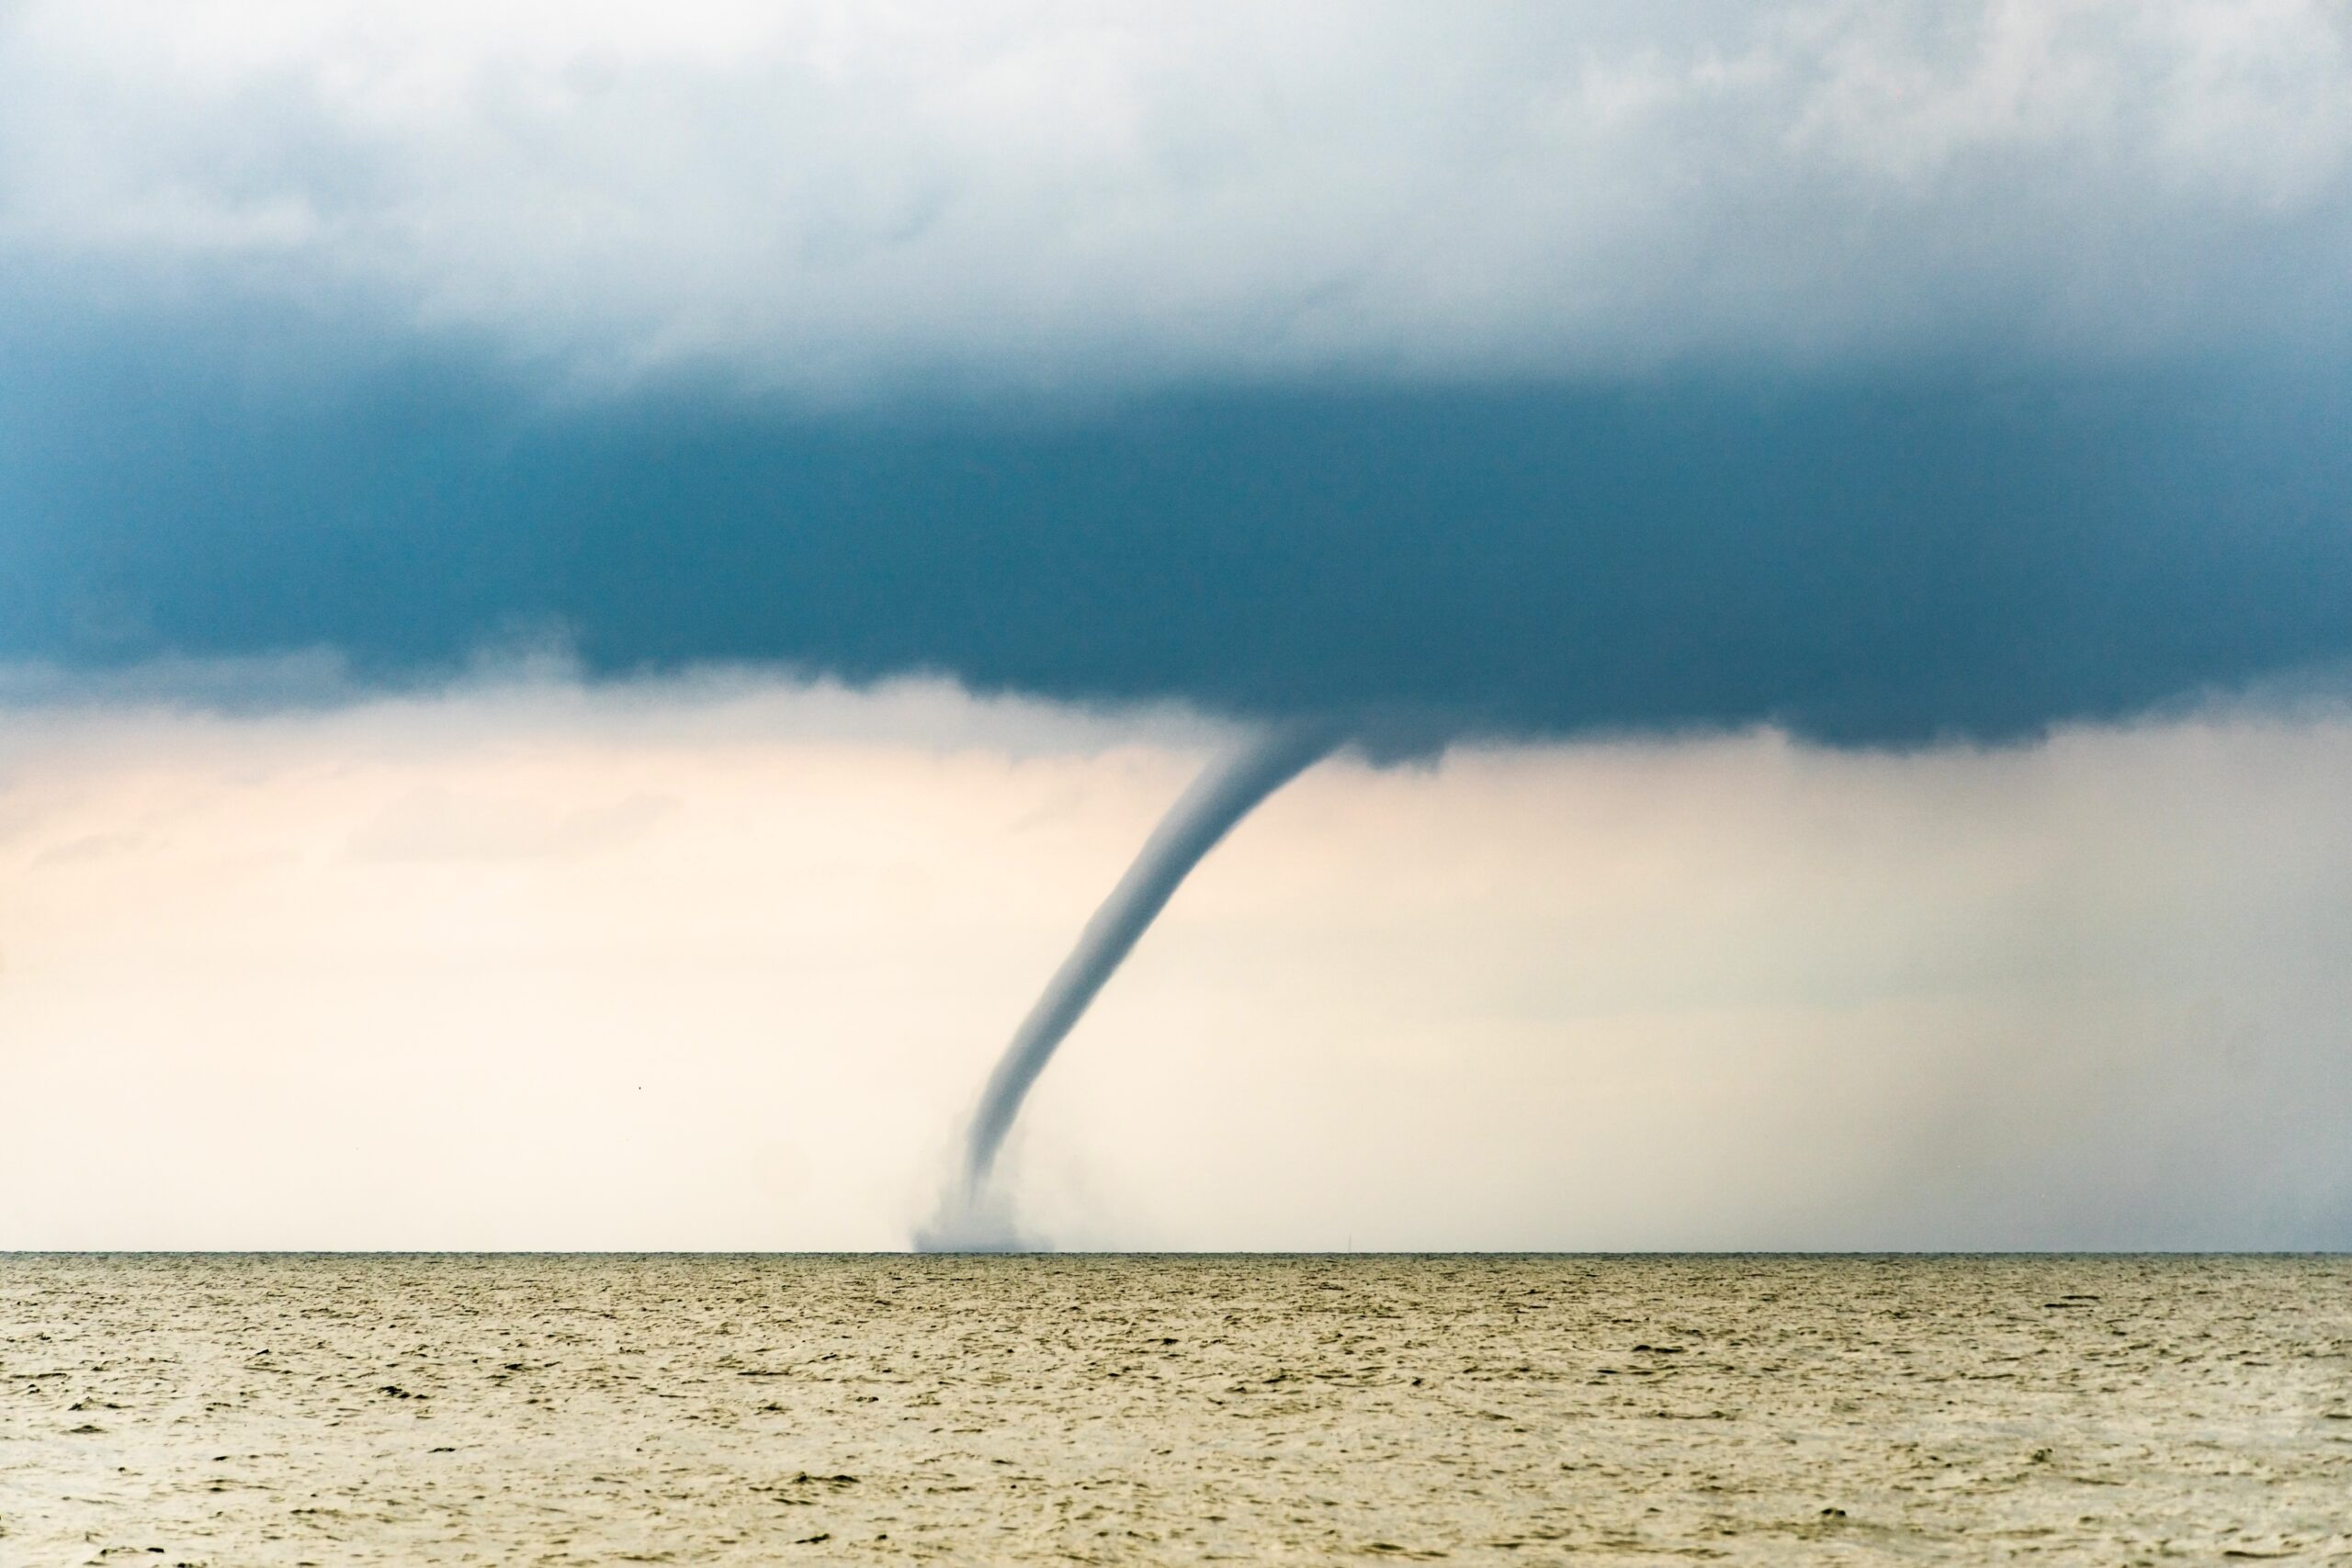
I have been on a boat in the ocean, no land in sight, and watched waterspouts ink out of an ominous cloud and explode the surface of the ocean.
I am tempted to call these experiences “otherworldly,” except there is nothing more grounded in place than extreme weather.
Constant fluctuation is part of coastal life. Rising and falling tides, shifting winds, and afternoon storms mean that to work and recreate safely, we need to be able to predict the weather.
How Do We Get Weather Forecasts?
Access to weather forecasts, for most people, is as easy as opening an app on your phone. Most of us don’t think about the technology or labor that goes into making predictions for temperature, wind speed, or precipitation that seem to magically appear on our screens. It turns out that forecasting the weather is a complex activity that requires disciplinary training, a vast array of technology, and an artfulness that can only come with experience.
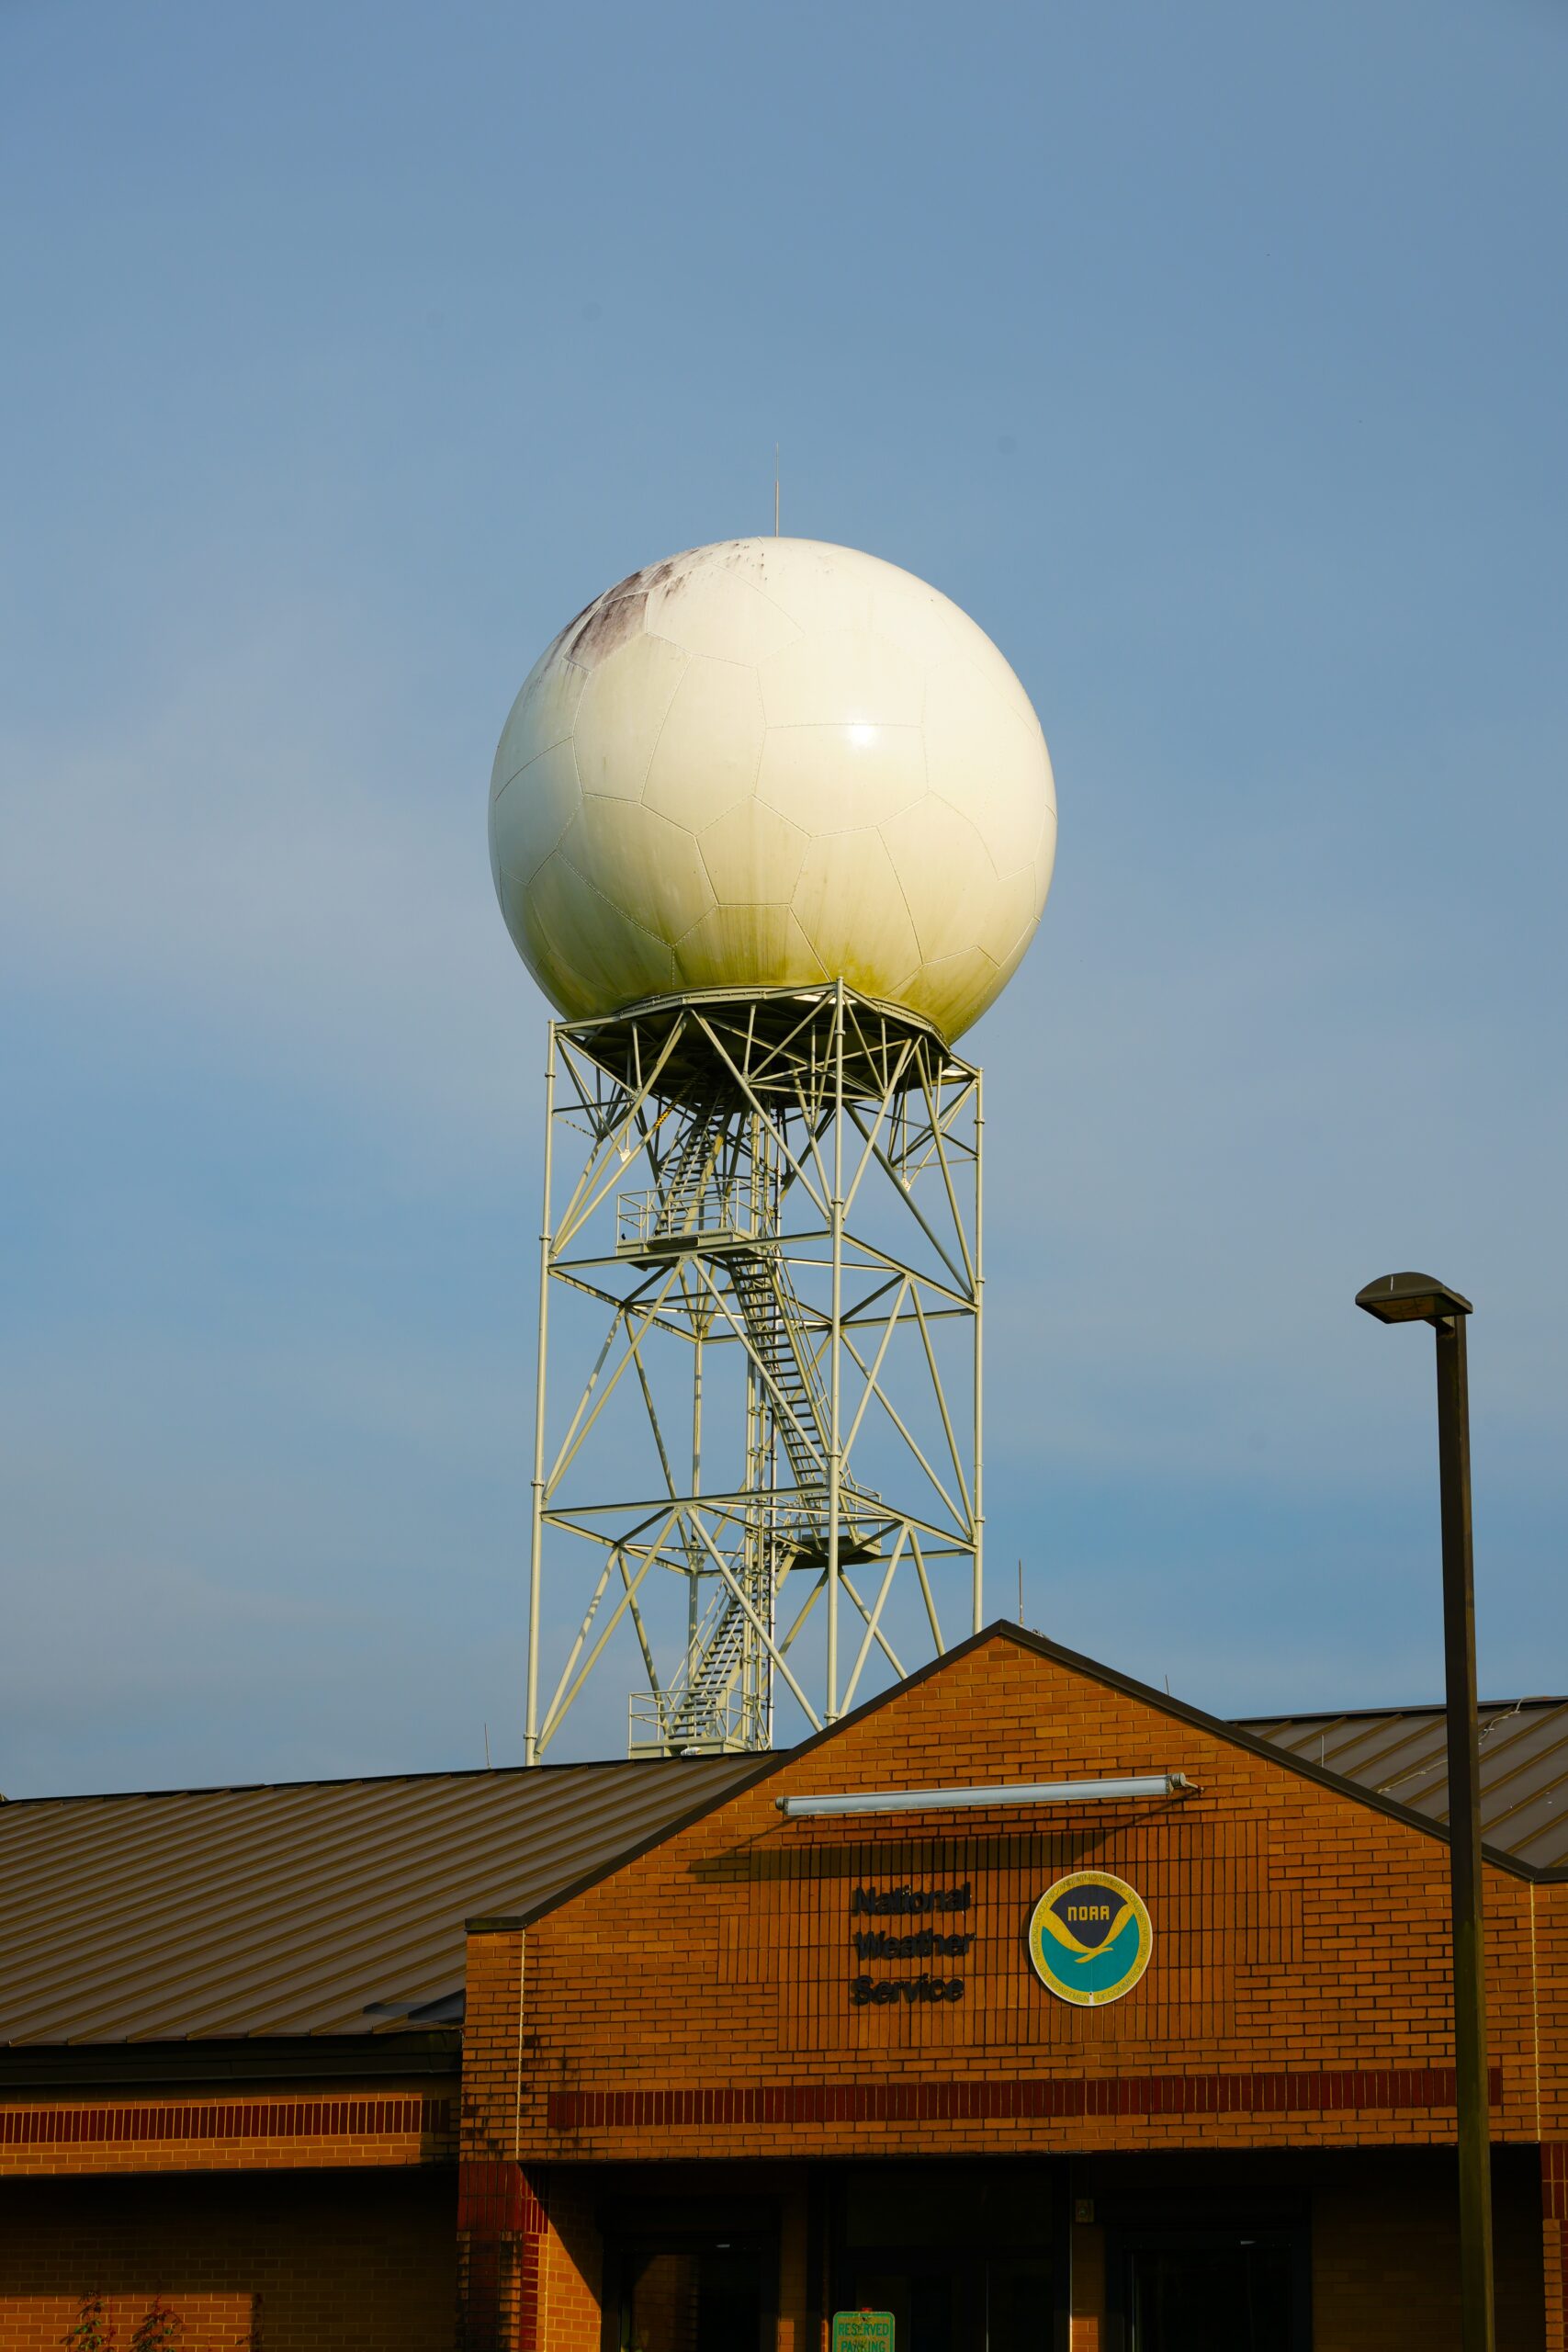
Our weather predictions are based on satellite imagery, strategically placed radar that detects particles like rain and snow, weather stations that provide real time data on temperature and wind speed, and the global weather balloon system. There are 122 National Weather Service (NWS) offices strategically placed across the United States, each one monitoring 20-50 counties, 24 hours a day, seven days a week, 365 days a year. This does not include all of the regional headquarters for NWS or the special offices that monitor our nation’s rivers or hurricanes.
The data gathered at all of these locations feeds into computer models that help forecasters make predictions. These models are built on decades of data and observations.
I met with Ryan Ellis, Science and Operations Officer, at the NWS office in Newport/Morehead City to see how the work is done. Every NWS office is situated in a specific landscape.
Forecasters need to understand the physical environment of a place to make accurate predictions. When Ellis moved from the Raleigh office, located in the piedmont, to the coastal office, he says it was a big adjustment. What was the hardest thing to learn?
“The winds, for sure,” says Ellis. “I was lost when I first came here.” Of course, now, he’s a pro.
Experienced forecasters have a deep understanding of local geographic features and how they might influence weather. “The open ocean water acts differently than the sounds,” says Ellis. “Institutional knowledge plays a role in how we get forecasts.”
The Newport/Morehead City office is in a nondescript brick building off of HWY 70. Inside, we pass by a long rectangular room with a large table, chairs, and big screens.
“During Hurricane Florence, people were living in the conference room for about four days,” Ellis says.
As a federally funded program, the primary objective of the NWS is to serve the public. Ellis explains that NWS offices are a hub for news during any weather emergency, and local emergency managers rely on their expertise to make decisions about public safety.
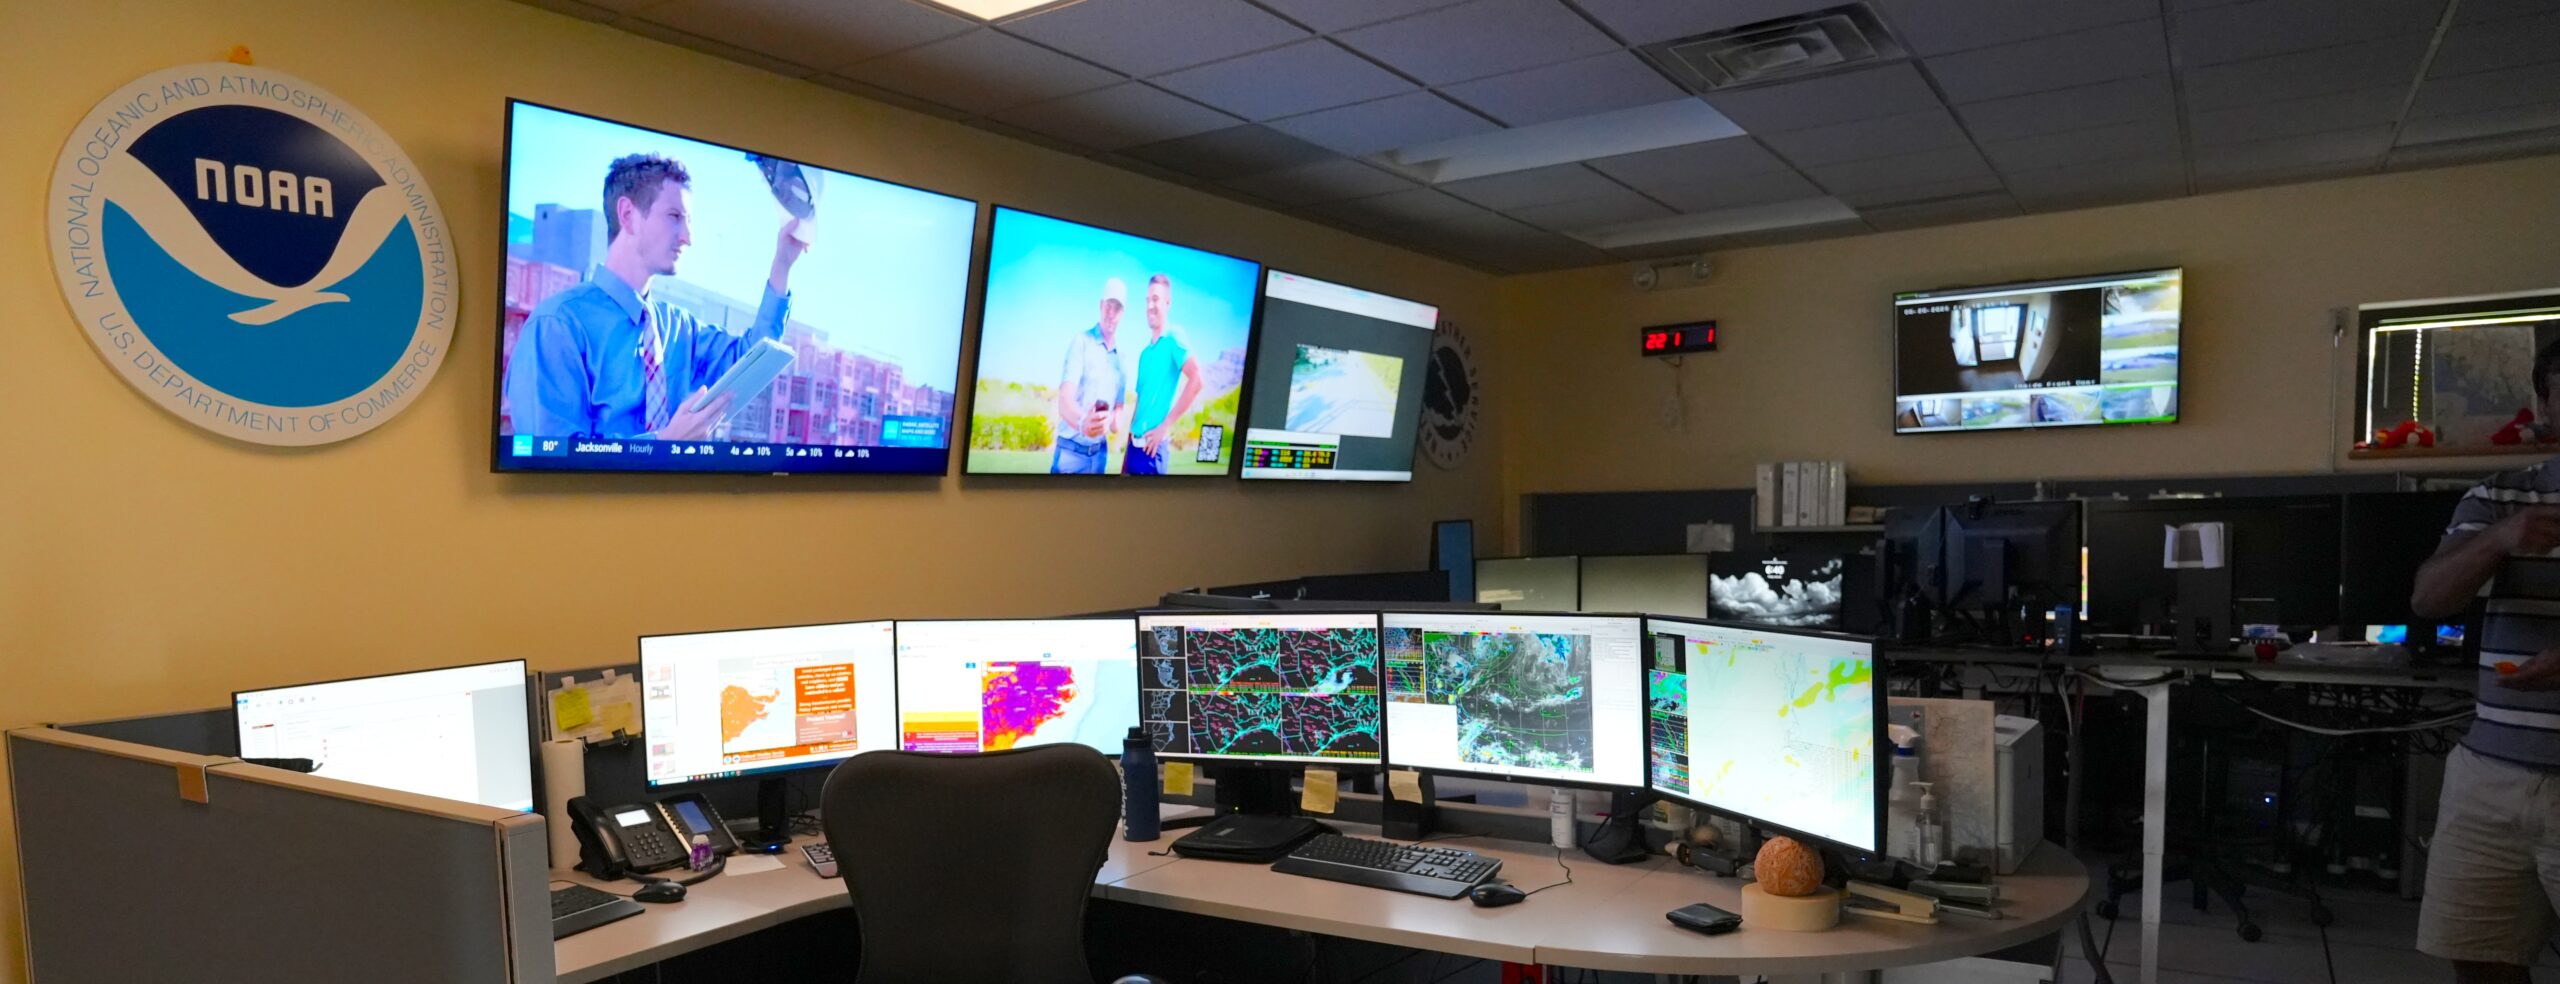
In the nerve center of the building are several stations, each with at least four large monitors. Monitors are filled with data lists, satellite views overlaying maps, radar imagery, and other National Oceanic Atmospheric Administration (NOAA) products. NOAA products help forecasters share visualizations of weather events to make them easier to read, such as the “zone forecast,” which offers snapshots of the weather across a specified area, or the “seven-day tropical weather outlook” issued by the National Hurricane Center.
Additional monitors display various weather channel feeds high across one wall. Ellis runs me through some of the products at an open station, and I start to piece together how this quiet team of five rapidly scans data that will eventually become the daily and weekly forecast I see when I open weather.gov.
“Every forecaster is a little bit different in how they set up,” says Ellis. Forecasters make decisions about which products to load on each screen to help them determine the day’s weather. “One forecaster might be a pretty detail-oriented person. I’m a big picture person, and so our forecasting setups will be completely different.”
Ellis shows me satellite images on one screen depicting a large portion of the Atlantic. On another screen is a grid. These are models and products he might choose for an initial forecast. “We can plug in the model to start,” he says, “but then we’re going to make little adjustments to it as needed.”
On Modeling
Modern forecasts are based on models. Good models are based on high quality observations. Physical observations are real-time records of variables like rainfall, humidity, and temperature. This observational data needs to be accurate and collected on a schedule to provide a view of weather patterns.
Patterns tell a story about a place.
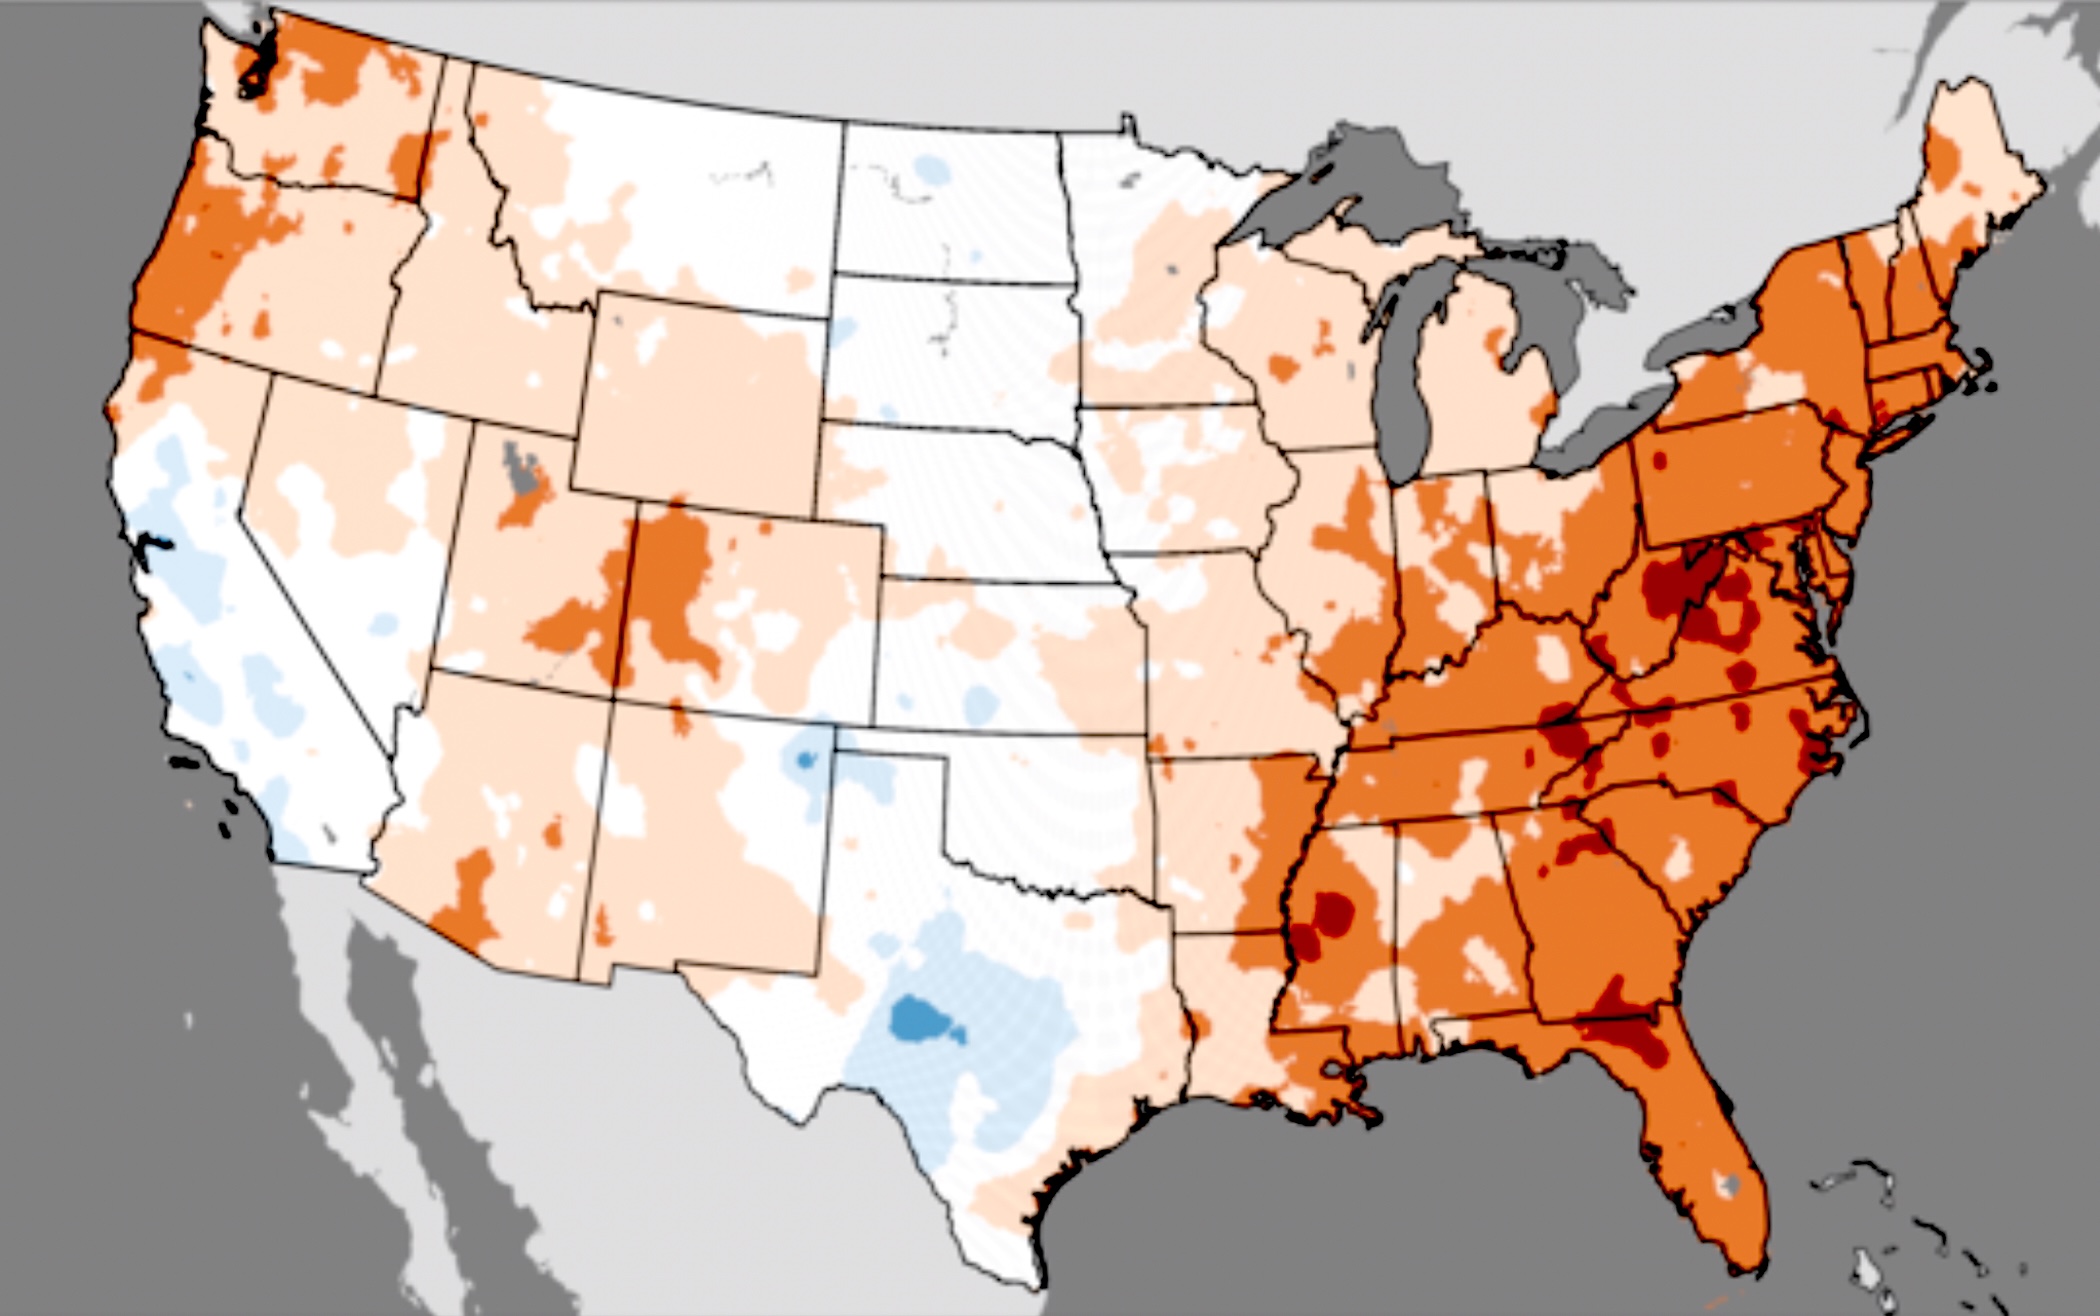
Since we have daily temperature data from 1895 to the present, we can get a picture of changes in the average temperature. The temperature map above from the National Centers for Environmental Information tells the story of rising temperatures in some parts of the US.
Based on long-term data and current conditions, the mathematical calculations built into each model will tell a forecaster, for instance, if high humidity or low pressure in a particular region (such as April on the coast in North Carolina) will lead to storms or a sunny, clear day. Only with the increased computing power that became available in the 1970s can modeling work as it does today.
Today we use “ensemble modeling.” This means that forecasters run a particular model several times with slightly different initial conditions to assess which one seems most accurate based on their knowledge of the place.
The complex math of the models and the decisions made by forecasters, for the average weather seeker, is made visual as the “extended forecast” on your weather app.
The NWS uses a wide variety of models. Ellis explained that each model has a “bias.” Some models might overestimate the amount of rainfall or underestimate the temperature. Forecasters take that into account.
There is the High Resolution Rapid Refresh (HRRR) model for short-term high-resolution forecasts, the North American Model (NAM) to create short range forecasts for the North American continent, and even the Global Forecast Systeme (GFS) that is used for both US and global forecasting. Other countries use their own models, such as the European Center for Medium-Range Weather Forecasts (ECMWF). There is a good deal of debate about which one is “most accurate.”
Sandra Yuter, distinguished professor and faculty fellow at the Center for Geospatial Analytics at North Carolina State University, explains that the world meteorological association has agreements, and “everybody shares data with everybody else.”
Deciding which model works best, tweaking forecasts, and accounting for unusual local conditions requires training. Yuter teaches Introduction to Atmospheric Science at NC State University, the first course in the university’s atmospheric science degree.
“Meteorology is the application of physics and math,” explained Yuter. In addition, students must also take chemistry and, increasingly, computer science courses. Public training is also key to this career path.
A good forecaster is well-trained with years of on-the-ground experience. For Ellis, the job is to take “extremely complicated science and bring it down to the level that your grandmother can understand. And so that’s an art form in itself.”

Balloons and Weather
Accurate predictions require experienced forecasters and data sourced from long-term, high-quality observations.
One important way to get high-quality observations of weather across the globe is through weather balloons. At full capacity, NWS launches 91 weather balloons twice a day, 12 hours apart, every day. Globally, the estimate is 1,800.
Ellis showed me the weather balloon process at the Newport/Morehead City office, and meteorologist Morgan Simms offered me a demonstration. It starts in a room full of weather balloon kits outfitted with an instrument pack that their team first baselines with equipment at the office. There is a barometer to measure pressure and a rain gauge that they empty every night and check in the mornings.
Ellis’s facility has its own hydrogen generator to fill the balloon (though some offices use helium). Forecasters then tie it to a shepherd’s hook outside and wait for the appointed time. Along with all the balloons across the world, they release and track it using GPS up to 100,000 feet (where is usually bursts). Most of the ballon parts are biodegradable.
As the balloon moves through the atmosphere, it gathers data on temperature, wind, relative humidity, and pressure and immediately sends it back to computers in the office. The data fuels the models forecasters use to make predictions.
Other than “updates in technology, the process has been the same since World War II,” says Ellis.
Launching the balloons can be difficult in bad weather. It is challenging to manage a five- foot-wide balloon on a windy day. One year a balloon hit a power line on a gusty Christmas Eve and knocked out the power, explained Ellis. But the data is so valuable around the world that this work is an essential task at every weather service office designated to operate them. The process requires operators to be certified and to renew that certification regularly. More than one person at each office needs to be able to do the work.
Recently, the Washington Post reported that fewer balloons are going up due to hydrogen and helium shortages and cuts in federal funding and workers. Unfortunately, a model is only as good as the real-world data that feeds it.
Accounting for Extremes
The data that NWS offices collect and pour into the models is part of what NOAA uses to evaluate long-term patterns.
Changes in long-term patterns might be a blip, or they might indicate a new trend. “It’s that consistent routine observation over years and decades where we can see patterns,” says Yuter. “Are things stable? Are they trending down? Are they trending up?”
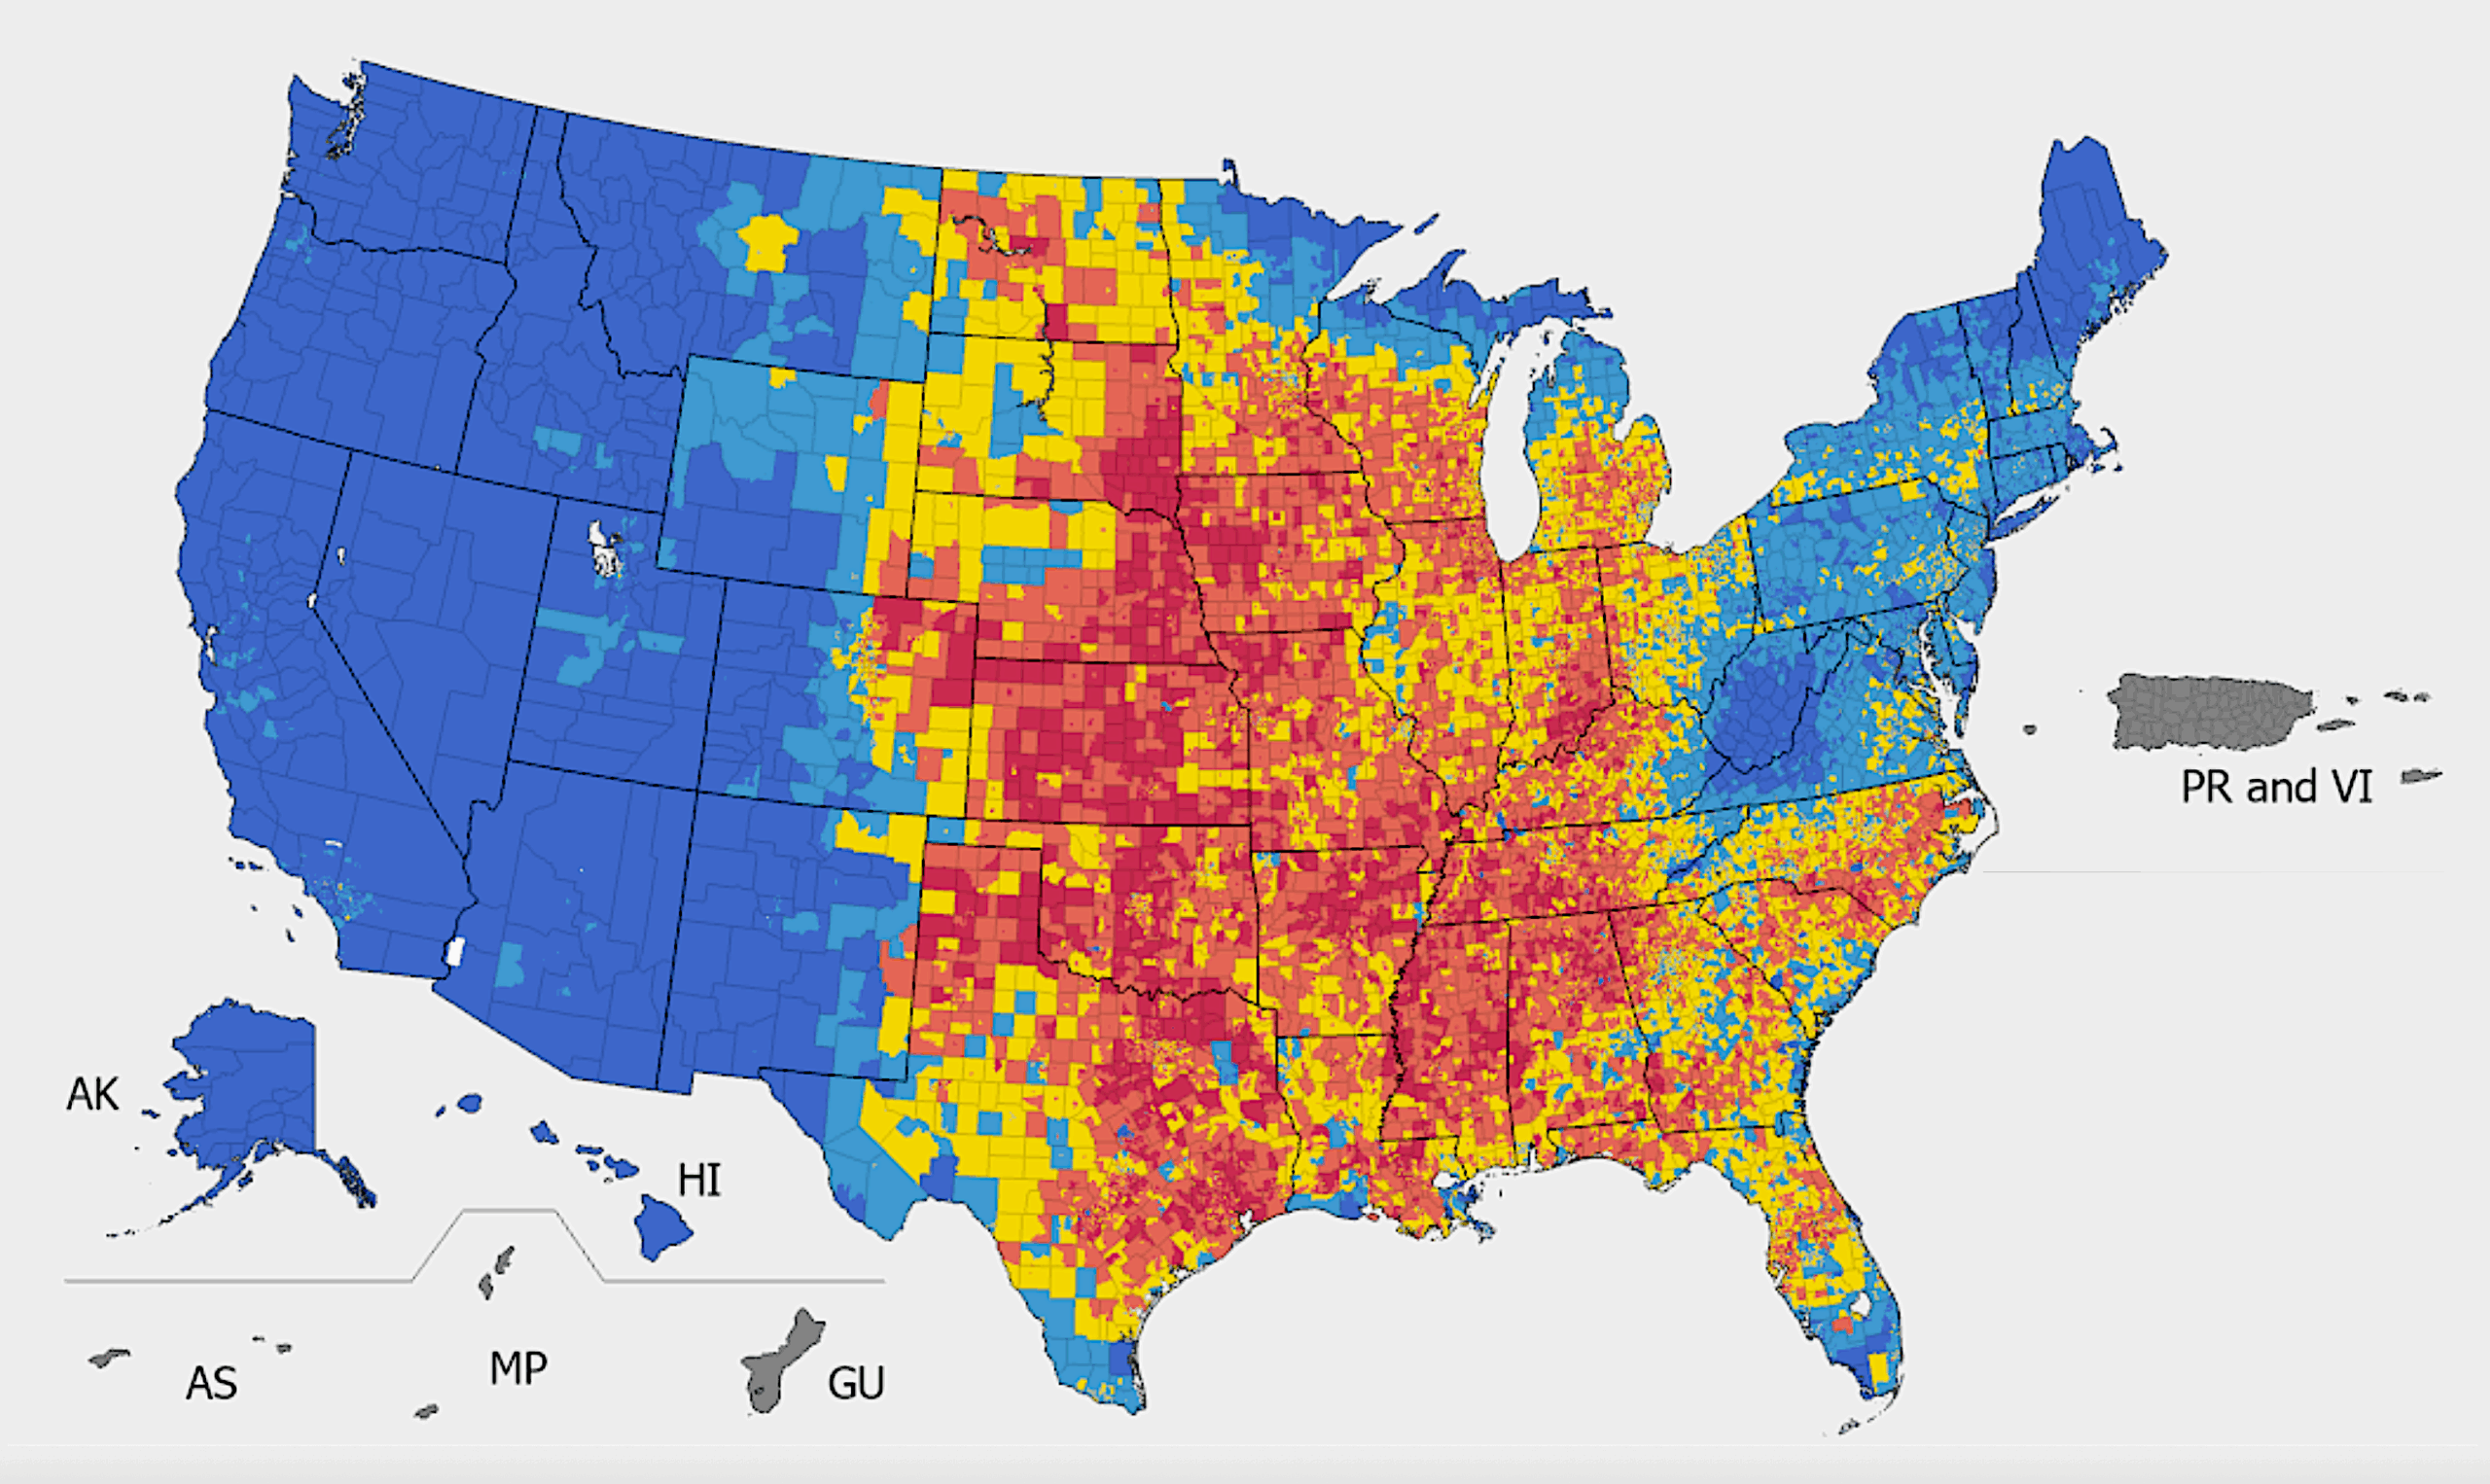
For instance, a recent Scientific American article outlined data that points to a shift in “tornado alley,” a geographic location in the U.S. where tornadic activity is high. For decades tornado alley was mostly in Texas and Oklahoma, which prompted communities to build tornado shelters. Now that line, or area of high tornadic concentration, is moving east.
I was in Chattanooga, Tennessee in 2011 during what is now called the “2011 Super Outbreak.” I sat under our stairs with my young son waiting for the storms to pass. We did not have a tornado shelter at our home, and I didn’t even consider that I might need one when I moved to Tennessee for work. Our electricity was out, but I could still get texts. My dad sent radar images, most likely from the NWS Huntsville, Alabama radar, that warned us as new waves of storms rose up.
For Ellis, understanding long-term local patterns is important for making a good forecast. For example, if scientists or forecasters are noting a consistent shift in “normal” patterns, Ellis says he might look more closely at a model forecast that predicts a weather event closer “to the edges of extreme.”
When Yuter teaches her freshmen introductory course, she emphasizes this: “Weather is about minutes and weeks. Climate is about years, decades, or even centuries.”
The weather patterns of the Earth have changed in its long history. “For example, we know that during the time of the dinosaurs it was hotter and moister here in North Carolina, and that during the Ice Age, much colder,” says Yuter.
Yuter offers a sports metaphor. Baseball has a large number of games in one season and all the games determine a team’s record and whether or not they will make the playoffs. Winning or losing one game would not cause anyone to predict a playoff bid. Teams have off days, unusual circumstances, or even bad weather at the stadium. One game is like the weather. The whole season is like the climate.
Duke University student Tessa Nylan’s article in The Assembly interviews community members who live Down East in Carteret County, North Carolina. While locals and scientists might use different words to describe changing patterns, residents know that sea levels are rising, that hurricanes come more often, and they want to plan for it. Several North Carolina Sea Grant projects actively work to help communities manage changes in flood and storm water patterns and to understand all the variables, including weather, that contribute to the shifts. At the end of this article, see links for “The Guide to Coastal Living,” as well as a discussion of weather and water quality and research on sunny day flooding.
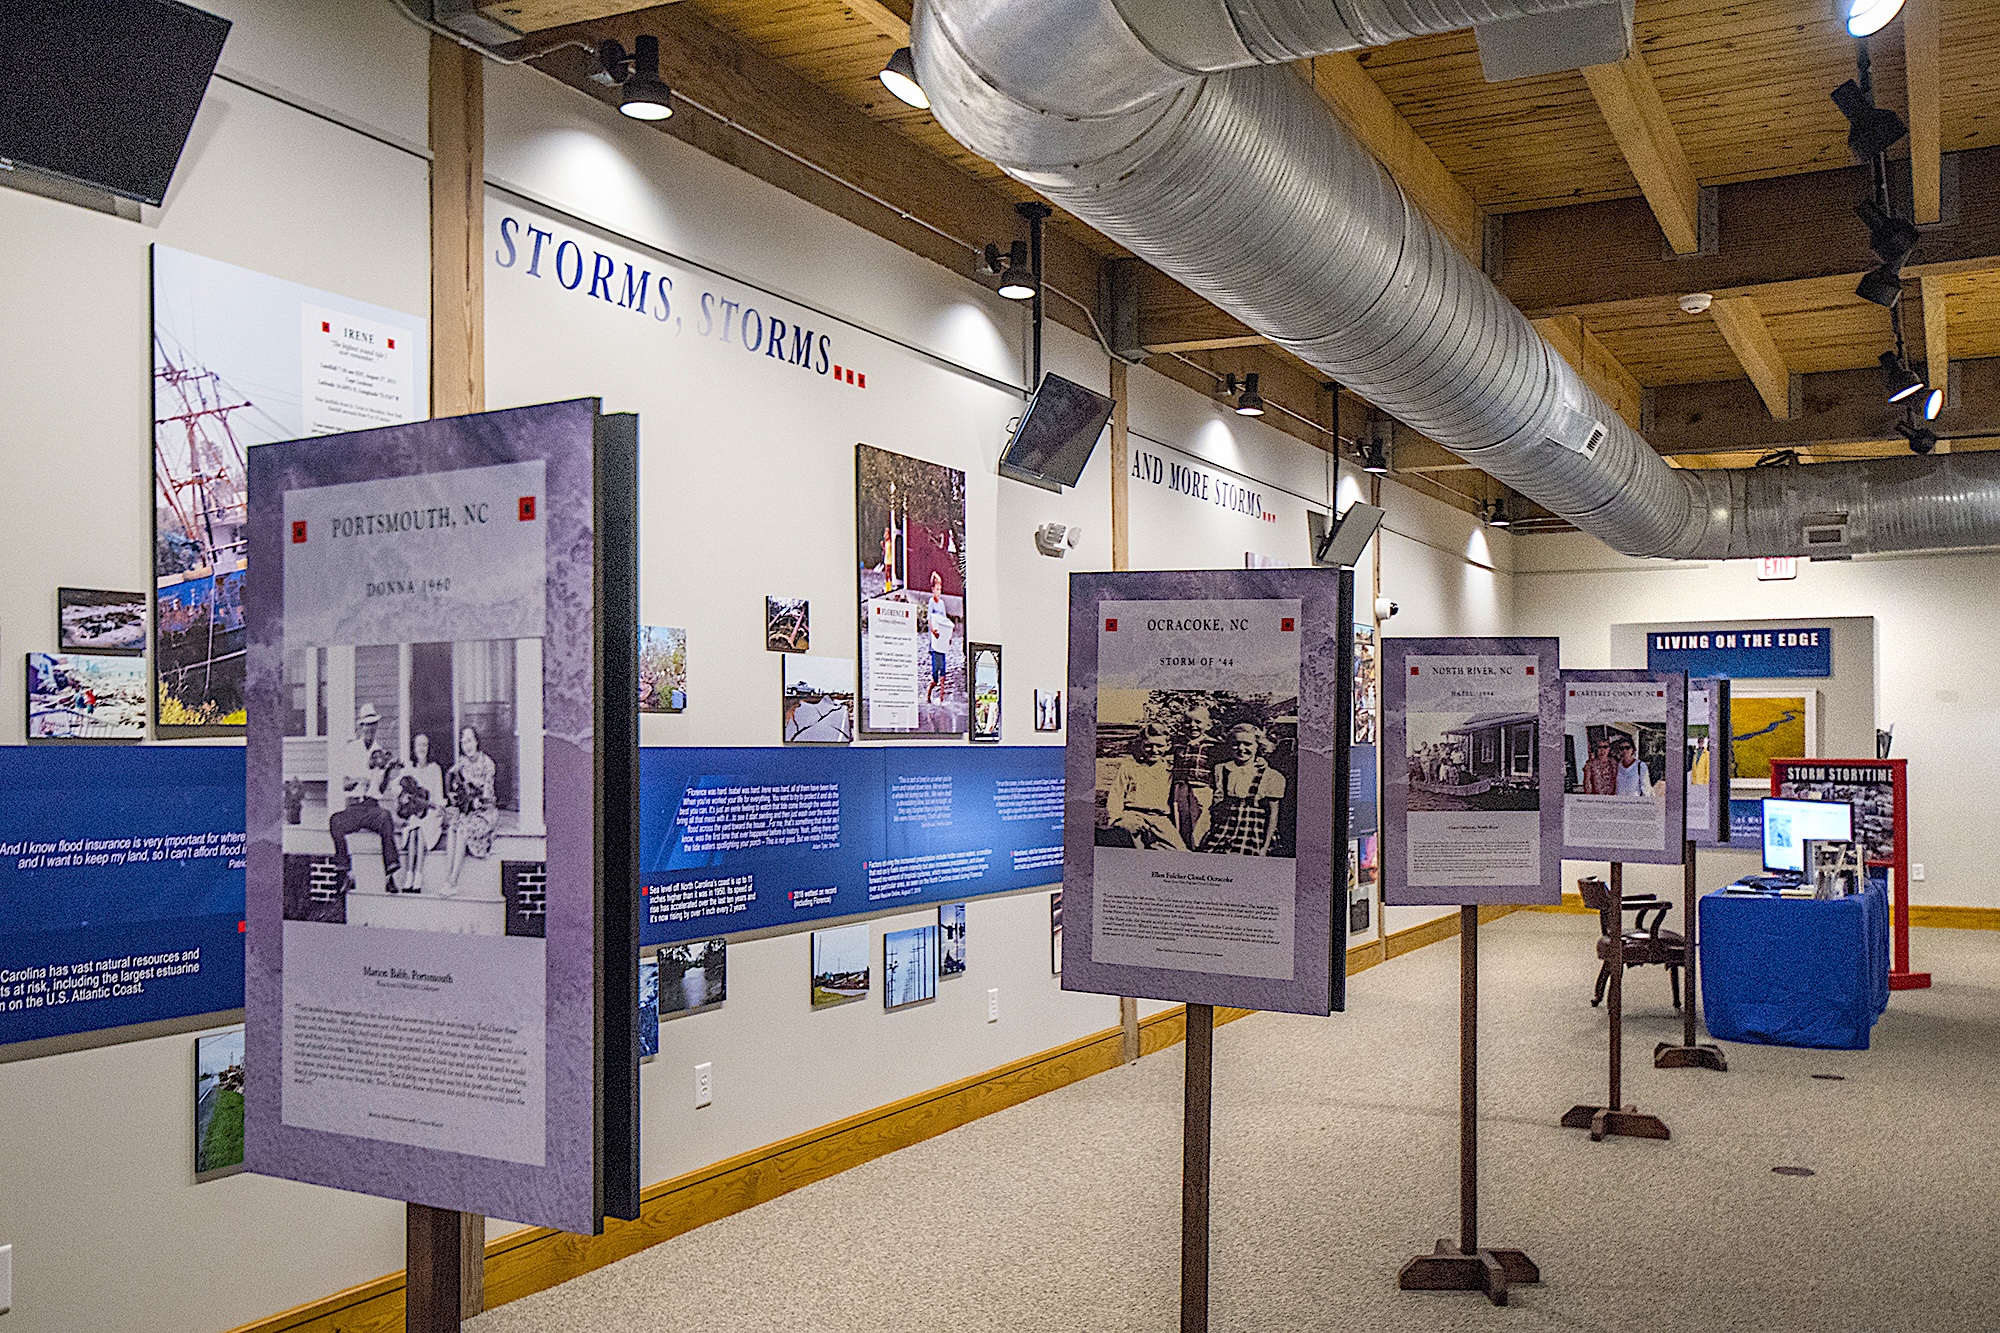
North Carolina Sea Grant has funded, along with partners, projects at the Core Sound Waterfowl Museum and Heritage Center with director Karen Amspacher, featured in Nylan’s story. One exhibit, “Living on the Edge,” documents the “physical changes of North Carolina’s coast that have resulted from rising seas and changing landscapes through the voices of community members who’ve witnessed these changes,” according to Core Sound’s website.
The primary display works as a hurricane timeline with photographs and quotations provided by locals. Each hurricane is marked on the timeline that starts on a small wall and curves to cover a much larger wall, the length of room. It struck me that there are long gaps between the early storms: San Ciriaco 1899 to Storm of 1933. As you move down the timeline, the gap between storms is shorter and shorter. Hazel (1954) was an epic hurricane burned in my own family history. After this, the pace picks up: Donna (1960), Ash Wednesday Storm (1962), Gloria (1985), Dennis (1999), Floyd (1999), Isabel (2003), Irene (2011), Florence (2018), Dorian (2019).
Rendered artistically, it is easier to see a changing pattern. The display emphasizes both the resilience of the community and the need for adaptations.
Communities increasingly prone to extreme weather will continue to rely on the expertise of the NWS to parse the data and give us forecasts that account for these changes.
More
Tornado Alley’s Eastward Shift
Down East Views on Changing Weather Patterns
“Above and Below: The Impacts of Weather Events on Water Quality and Quantity”
“Sunny with a Chance of Floods”
“Living on the Edge” at Core Sound Waterfowl Museum & Heritage Center
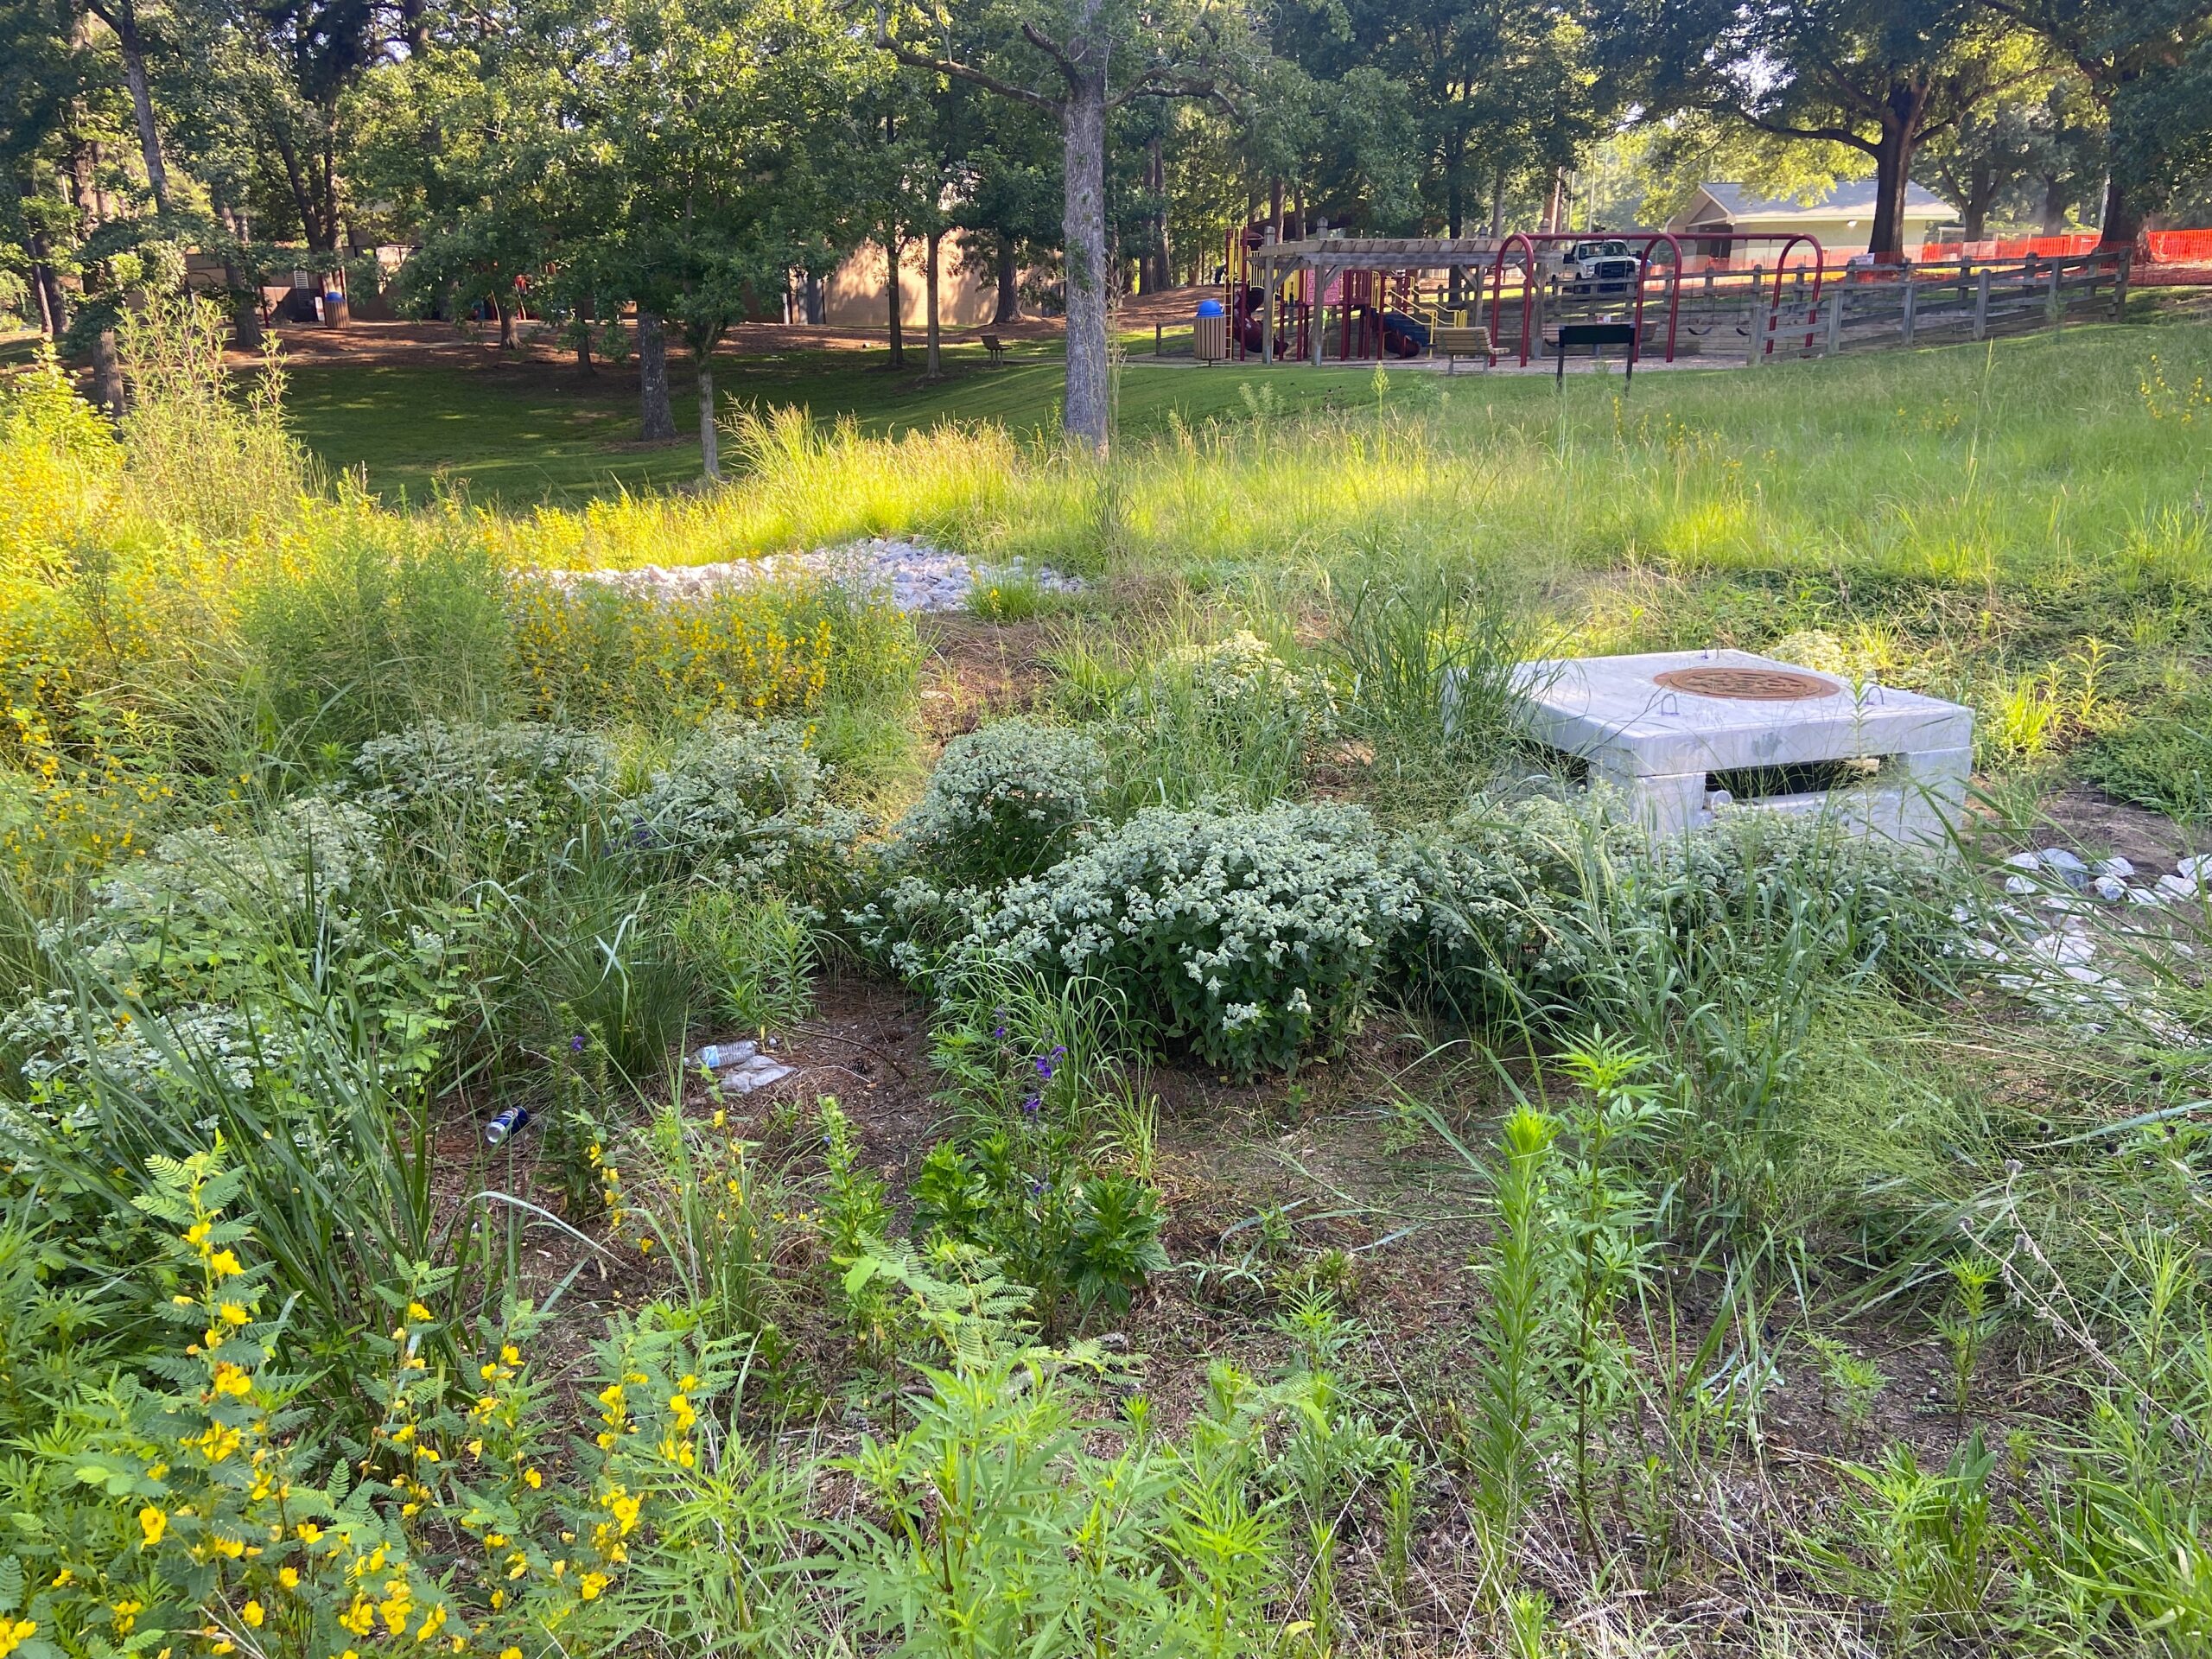
lead image: Adobe Stock.
Rebecca Jones is editor-at-large for Coastwatch and communication director for North Carolina Sea Grant, NC Space Grant, and the NC Water Resources Research Institute. She worked as a writing studies professor for over 20 years.