Ferrymon Connects Students To Water Quality

As an eighth-grade science teacher, Karen Davis seeks to link water quality to real-world applications.
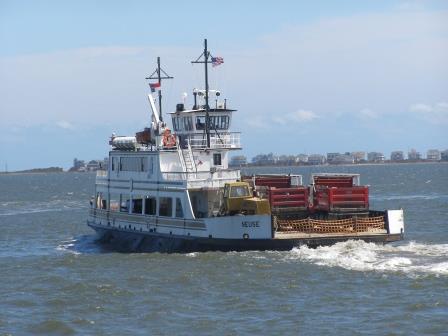
Last spring, Davis logged onto “Estuary Live 2007” to view a virtual trip aboard FerryMon, the Ferry-based Monitoring of Surface Water Quality on the N.C. Department of Transportation (NCDOT) ferry system. The program keeps watch on water quality in the Pamlico Sound and its tributaries.
This spring, Davis will take her eighth-grade students at Beaufort Middle School aboard one of three North Carolina ferries that collect water quality data.
“FerryMon is a direct link to real-world applications in the study of water quality on the coast,” Davis says. “Students can go online, see data recorded and make comparisons between historic data and their own observations. They also can see how governmental agencies and university scientists are using technology to help one another.”
Since 2001, teachers have accessed online data about temperature, salinity, chlorophyll — the water’s algae content — and other parameters in the Pamlico Sound. They also OB download a poster, brochure and worksheet on the topic. In addition, students can track water quality conditions.
“FerryMon teaches students how to use data to make plots, graphs and examine trends in water quality for purposes.” says North Carolina Sea Grant researcher Hans Paerl. “It also helps them understand how the Pamlico Sound and the Neuse River are impacted by human activities and climatic changes.”
Paerl, a professor of marine and environmental sciences at the University of North Carolina at Chapel Hill’s Institute of Marine Sciences, is FerryMon co-director, along with Joseph S. Ramus, a professor of botany and oceanography at Duke University Marine Laboratory.
ONBOARD COLLECTION
Three NCDOT ferries are collecting data: the M/V Carteret that runs between Cedar Island and Ocracoke Inlet; the M/V Silver Lake that goes between from Ocracoke and Swan Quarter; and the M/V Floyd Lupton that runs between Minnesott Beach and Cherry Branch.
The instrumentation sits in a small tank inside each ferry’s protected sea chest below deck Some water needed to cool the ships’ air conditioning machinery is first diverted to devices that record temperature, salinity, pH, dissolved oxygen and chlorophyll.
Every minute, turbidity or water clarity and geographic position also are recorded. The information is sent from the ferry to the Duke and UNC labs via cell phone or the Internet and converted to graphics. Then the data are shared online with the N.C. Department of Environment and Natural Resources’ Division of Water Quality, the N.C. Division of Marine Fisheries, the federal Environmental Protection Agency, the National Oceanographic and Atmospheric Administration, other agencies, researchers, schools, and the general public.
Another device collects water samples that are tested for nutrients, algal pigments, harmful bacteria, dissolved organic matter and suspended solids that can decrease the clarity of the water.
“The frequency of data collection ensures that we have all-important information on where and when samples were gathered and tested,” Ramus says. “We’re also able to study daily, seasonally and yearly variations, cycles and trends and compare those with the effects of weather on algal abundances and excessive growth or ‘blooms’ that can be harmful to the environment. All data is being archived in digital form for further analysis.”
FerryMon started with support from North Carolina Sea Grant and the N.C. Hurricane Floyd Relief Fund to document the effects of the hurricane’s floodwaters on the Pamlico Sound. Today, the project is funded in large part by the N.C. General Assembly, at a cost of about $300,000 per year.
Paerl describes FerryMon as the state’s only water quality monitoring program for the Pamlico Sound, the second largest estuary in the U.S. and one of the nation’s most important fish nurseries. From an economic perspective, the sound is North Carolina’s most important fisheries resource, he adds.
Although North Carolina was one of the first to use oceanographic instruments on ferries in the United States, the idea dates back more than a decade in the Baltic Sea. Equipment was placed on ferries running between Helsinki, Finland, and Travemunde, Germany, a route covering some 400 miles.
“I saw how the ferries operated in Finland and came back fired up,” Paerl says. “I told Joe Ramus that we needed to put in a similar system in North Carolina.”
North Carolina’s ferry-based monitoring system has become a model for other coastal states. Marine scientists in Florida, Massachusetts, Maine, New York, California’s San Francisco Bay and Washington’s Puget Sound have begun designing comparable systems.
“FerryMon provides regular data that can be used from year-to-year and for long-term comparisons to assess trends in water quality,” says Barbara Doll, North Carolina Sea Grant water quality specialist. “It also makes wise use of resources because the ferry is already making the trip on a set schedule. So the expense of having a boat or device on which to mount sampling equipment is already covered.”
This spring, the monitoring system will expand to include data on carbon influx. Through a grant from the National Science Foundation’s Chemical Oceanographic Program, FerryMon staff will analyze carbon dioxide, an important greenhouse gas. “We will be looking at how the Pamlico Sound acts as a sink and source of this climate-altering gas,” Paerl says.
ECOSYSTEM MONITORING
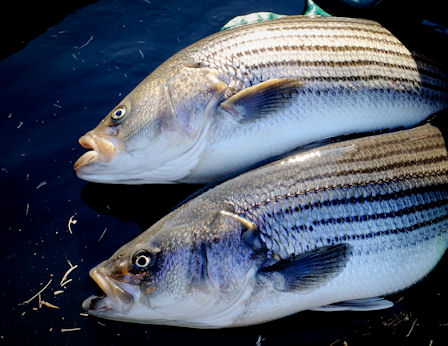
FerryMon is keeping pulse on the health of the Pamlico Sound, a critically important habitat for a variety of commercial and sportfishing species.
The monitoring system now forms the basis for evaluating and modeling how this ecosystem responds to human and natural impacts, Ramus says.
Remote sensing allows students, researchers and water quality managers an opportunity to take FerryMon’s measurements and scale them up to the entire sound by using mathematical formulas.
The DESTINY Traveling Science Learning Program has highlighted FerryMon data to hundreds of teachers since 2006. Based at the UNC-CH Morehead Planetarium and Science Center, DESTINY stands for “Delivering Edge-cutting Science Technology and Internet across North Carolina for Years to Come.” Its educators travel — from the mountains to the coast — with science labs to present “The State We’re In” workshops for teachers and teachers in-training to focus on environmental toxins.
“FerryMon is valuable because it presents real-life investigations into water quality,” says Amber Vogel of DESTINY.
The FerryMon information also has helped to keep state policymakers and scientists informed about changes in the Pamlico Sound after major hurricanes.
The project’s instruments collected water quality data for all but 36 hours during the passage of Hurricane Isabel in 2003. Paerl says that would have been nearly impossible with a small boat-based monitoring program.
“FerryMon showed us that windy but low-rainfall hurricanes like Isabel exerted much less severe and shorter duration of negative impacts on water quality than high rainfall hurricanes like Floyd,” he explains. “During Floyd, floodwaters caused multiple algal blooms and led to stressful conditions for fish and low oxygen conditions throughout the sound system for more than a year.”
One of the most recent storm collections was after Tropical Storm Ernesto in 2006.
FerryMon instruments began reporting high amounts of chlorophyll in the Neuse River, resulting from increased nutrients flowing down the river in the storm’s rainwater runoff.
FerryMon, along with the Neuse River Estuary Modeling and Monitoring Project (ModMon), showed when, where and how this nutrient “pulse” led to a mid-estuary bloom of the toxic dinoflagellate Karlodinium that was closely linked to fish kills reported after the storm in the same area, Paerl explains.
“The intensive monitoring capabilities of these program have enabled water quality managers and agencies to more clearly pinpoint and link such blooms to specific fish kills and improve assessments of the overall health of the estuary,” he adds.
In Davis’ classroom, students link the data to remote sensing images. “The students can convert colors to numbers and find out about chlorophyll levels and turbidity in the sound,” she adds.
The storm data also provides a big picture, Paerl explains.
“Youngsters can use this as a way of understanding how the Pamlico system works and how it responds to the effects of storms or human impacts such as waste water spills.”
Find out more about FerryMon.
This article was published in the Spring 2008 issue of Coastwatch.
For contact information and reprint requests, visit ncseagrant.ncsu.edu/coastwatch/contact/.
- Categories:


