Mapping the Future: Climate Change and Flooding in Coastal North Carolina
As seas rise and storms strengthen, new modeling will help communities assess heightened flood risks.

During the early morning hours of September 14, 2018, the eyewall of Hurricane Florence crossed onto the shore of Wrightsville Beach with 90 mph winds. Over the next few days, the storm produced record-breaking rainfall across the state and catastrophic flooding that caused 42 fatalities, as well as more than $16 billion in damage to nearly 75,000 structures.
Extreme weather events like Florence have always posed a threat to North Carolina and other parts of the southeastern United States. But as climate change accelerates, these storms are becoming more intense, increasing the likelihood and seriousness of flooding in many of the region’s urban and coastal areas.
“Over the past two decades, climate change has increased the frequency and severity of flooding beyond anything we’ve seen in history,” says Georgina Sanchez, a research associate at the Center for Geospatial Analytics in NC State’s College of Natural Resources. “It’s imperative that we understand how flood risk is likely to change in the future, given anticipated environmental changes.”
With funding from North Carolina Sea Grant, Sanchez and Elyssa Collins, a doctoral student at the Center for Geospatial Analytics, are collaborating with other researchers at NC State and the U.S. Geological Survey (USGS) on modeling that simulates the effects of climate change on flooding. The maps that Sanchez and her team are developing will help land-use planners across the state and country visualize and anticipate flooding hotspots, and, in doing so, potentially avoid property damage and loss of life.
“Flood maps are a vital component of community resilience,” Sanchez says. “We use them to determine which areas have a high risk of flooding and where to develop. But most flood maps underestimate risk. Communities can’t effectively plan for flooding if they don’t have flood maps that reflect the effects of climate change — including how sea level is rising and precipitation patterns are changing.”
Rising Seas and Stronger Storms
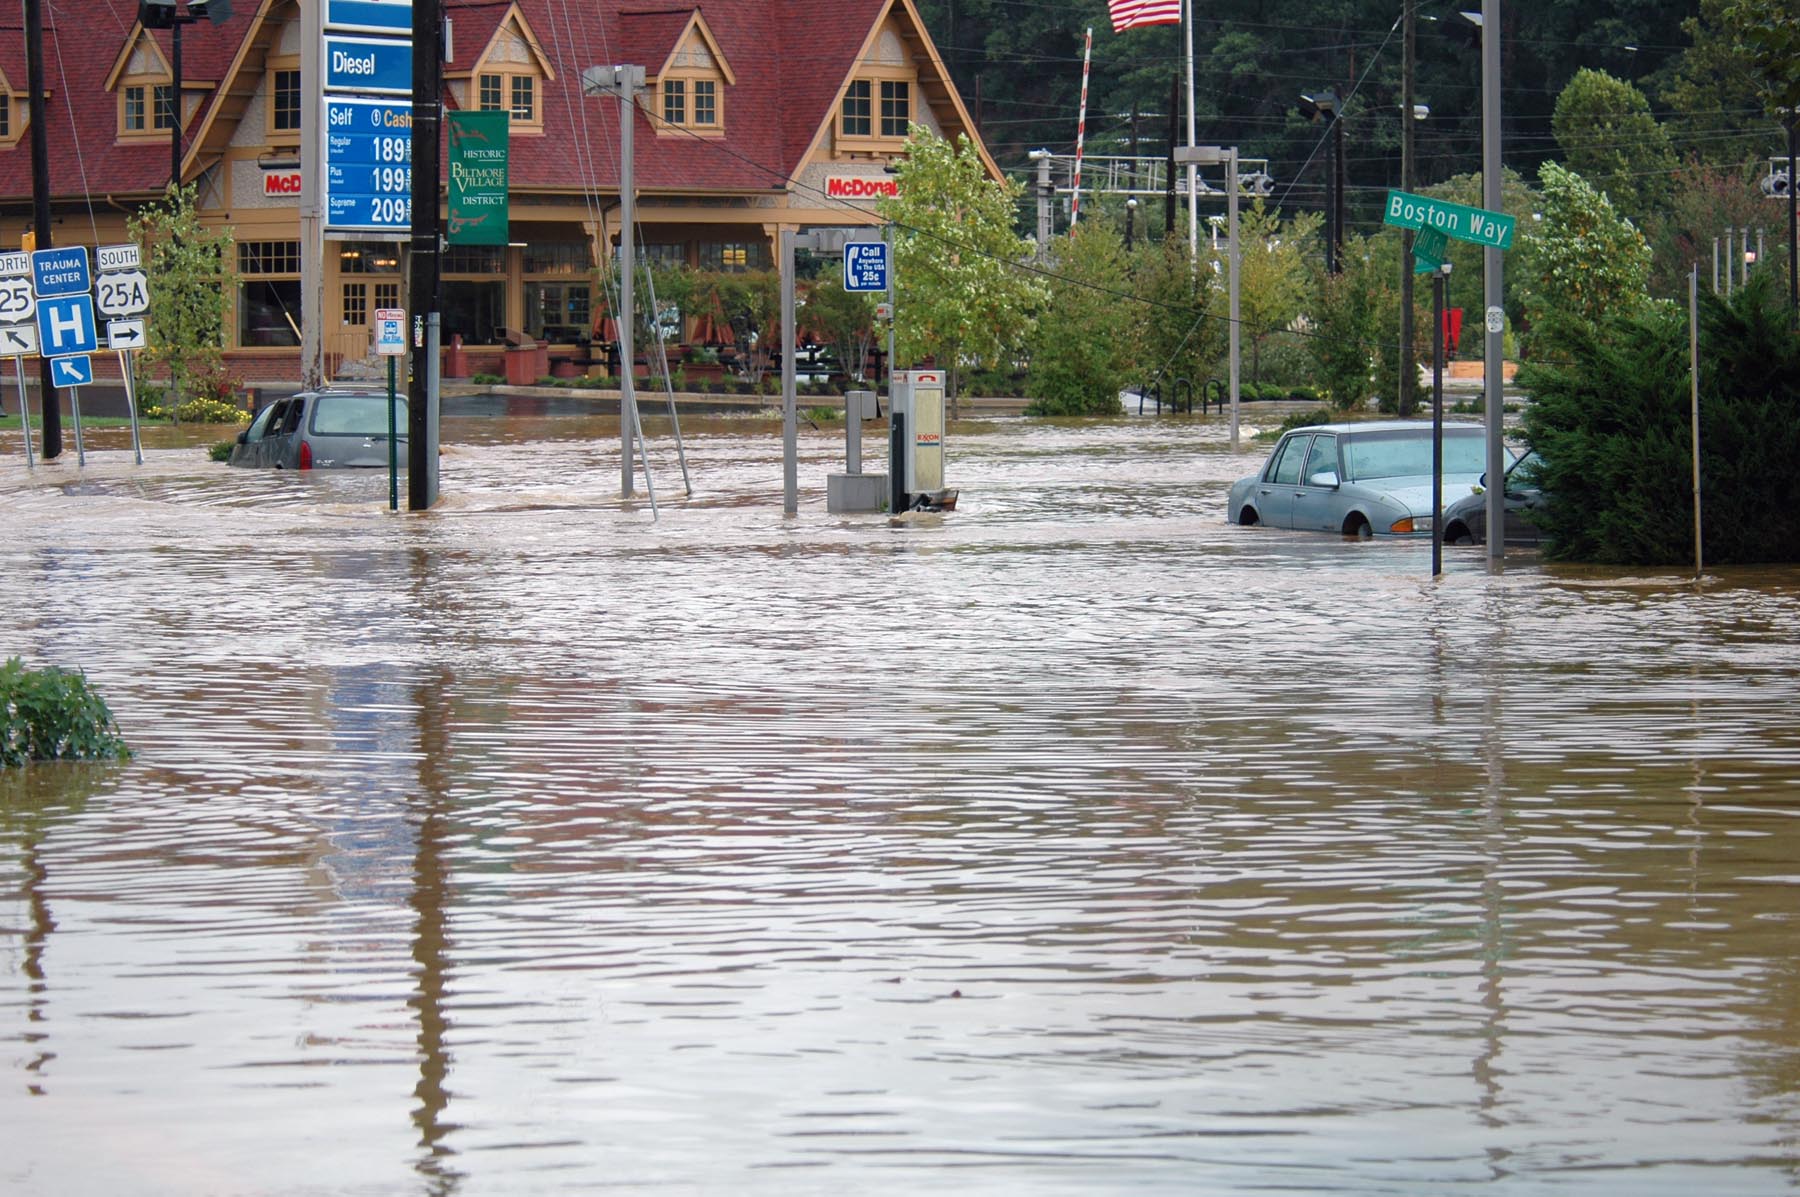
Flooding is the most common type of natural disaster in the U.S., mostly occurring when excessive rainfall over an extended period of time causes a river or stream to exceed its natural capacity. It can also occur when rainfall overwhelms urban drainage systems.
Cities are especially vulnerable to flooding as development converts naturally vegetated areas into parking lots, roads, and other impervious surfaces, says Charles Stillwell, a USGS hydrologist at the South Atlantic Water Center in Raleigh and a project collaborator.
“When it rains over a natural landscape, most of the water is absorbed by trees and soils,” Stillwell says. “But when those natural landscapes are converted into impervious surfaces, there are fewer trees and soils available to absorb the water. As a result, more water flows into the streams more quickly, which leads to more frequent and severe flooding.”
In North Carolina and across the southeastern U.S., many coastal communities have experienced increased flooding over the last few decades and will continue to do so as the rising temperatures associated with climate change shift rainfall patterns and exacerbate extreme weather events, especially hurricanes.
The Atlantic hurricane season officially runs from June 1 through November 30. When these storms make landfall, they can unload heavy and sustained rainfall that can overwhelm nearby rivers and drainage systems. They can also produce strong winds that push large volumes of ocean water ashore — an effect known as storm surge.
Size, speed, and track determine the amount of rainfall — and damage — a hurricane produces. Unfortunately, as the world’s oceans continue to absorb more than 90% of the increased atmospheric heat generated by greenhouse gas emissions, the intensity and duration of hurricanes are increasing.
A recent analysis published by the National Oceanic and Atmospheric Administration found that climate change has increased the likelihood of a hurricane developing into a Category 3 storm or higher by about 8% since 1979. And to make matters worse, scientists warn that climate change could eventually cause hurricanes to slow down, which would extend their progression over land and allow them to drop more rain.
But hurricanes aren’t the only source of flooding, Stillwell says. As a result of the added water from melting ice sheets and glaciers, as well as the expansion of seawater as it warms, global sea level has risen by about 8 inches since 1800. The increase in volume is pushing storm surges farther inland and worsening tidal flooding, which occurs when seasonal high tides temporarily inundate low-lying areas with seawater.
“Rising sea levels, compounded with storm surge and heavy rainfall, increase the risk of flooding in coastal communities,” Stillwell explains. “These communities are so far downstream that there is nowhere else for the water to go.”
Climate change models project that global sea level rise will continue to accelerate, which will cause frequent road closures, reduced stormwater drainage capacity, deterioration of infrastructure, and intrusion of saltwater into drinking water, among other impacts. In fact, by the end of the 21st century, the impacts of sea level rise could cost the global economy an estimated $14.2 trillion in lost or damaged infrastructure.
Flood Maps with Flaws
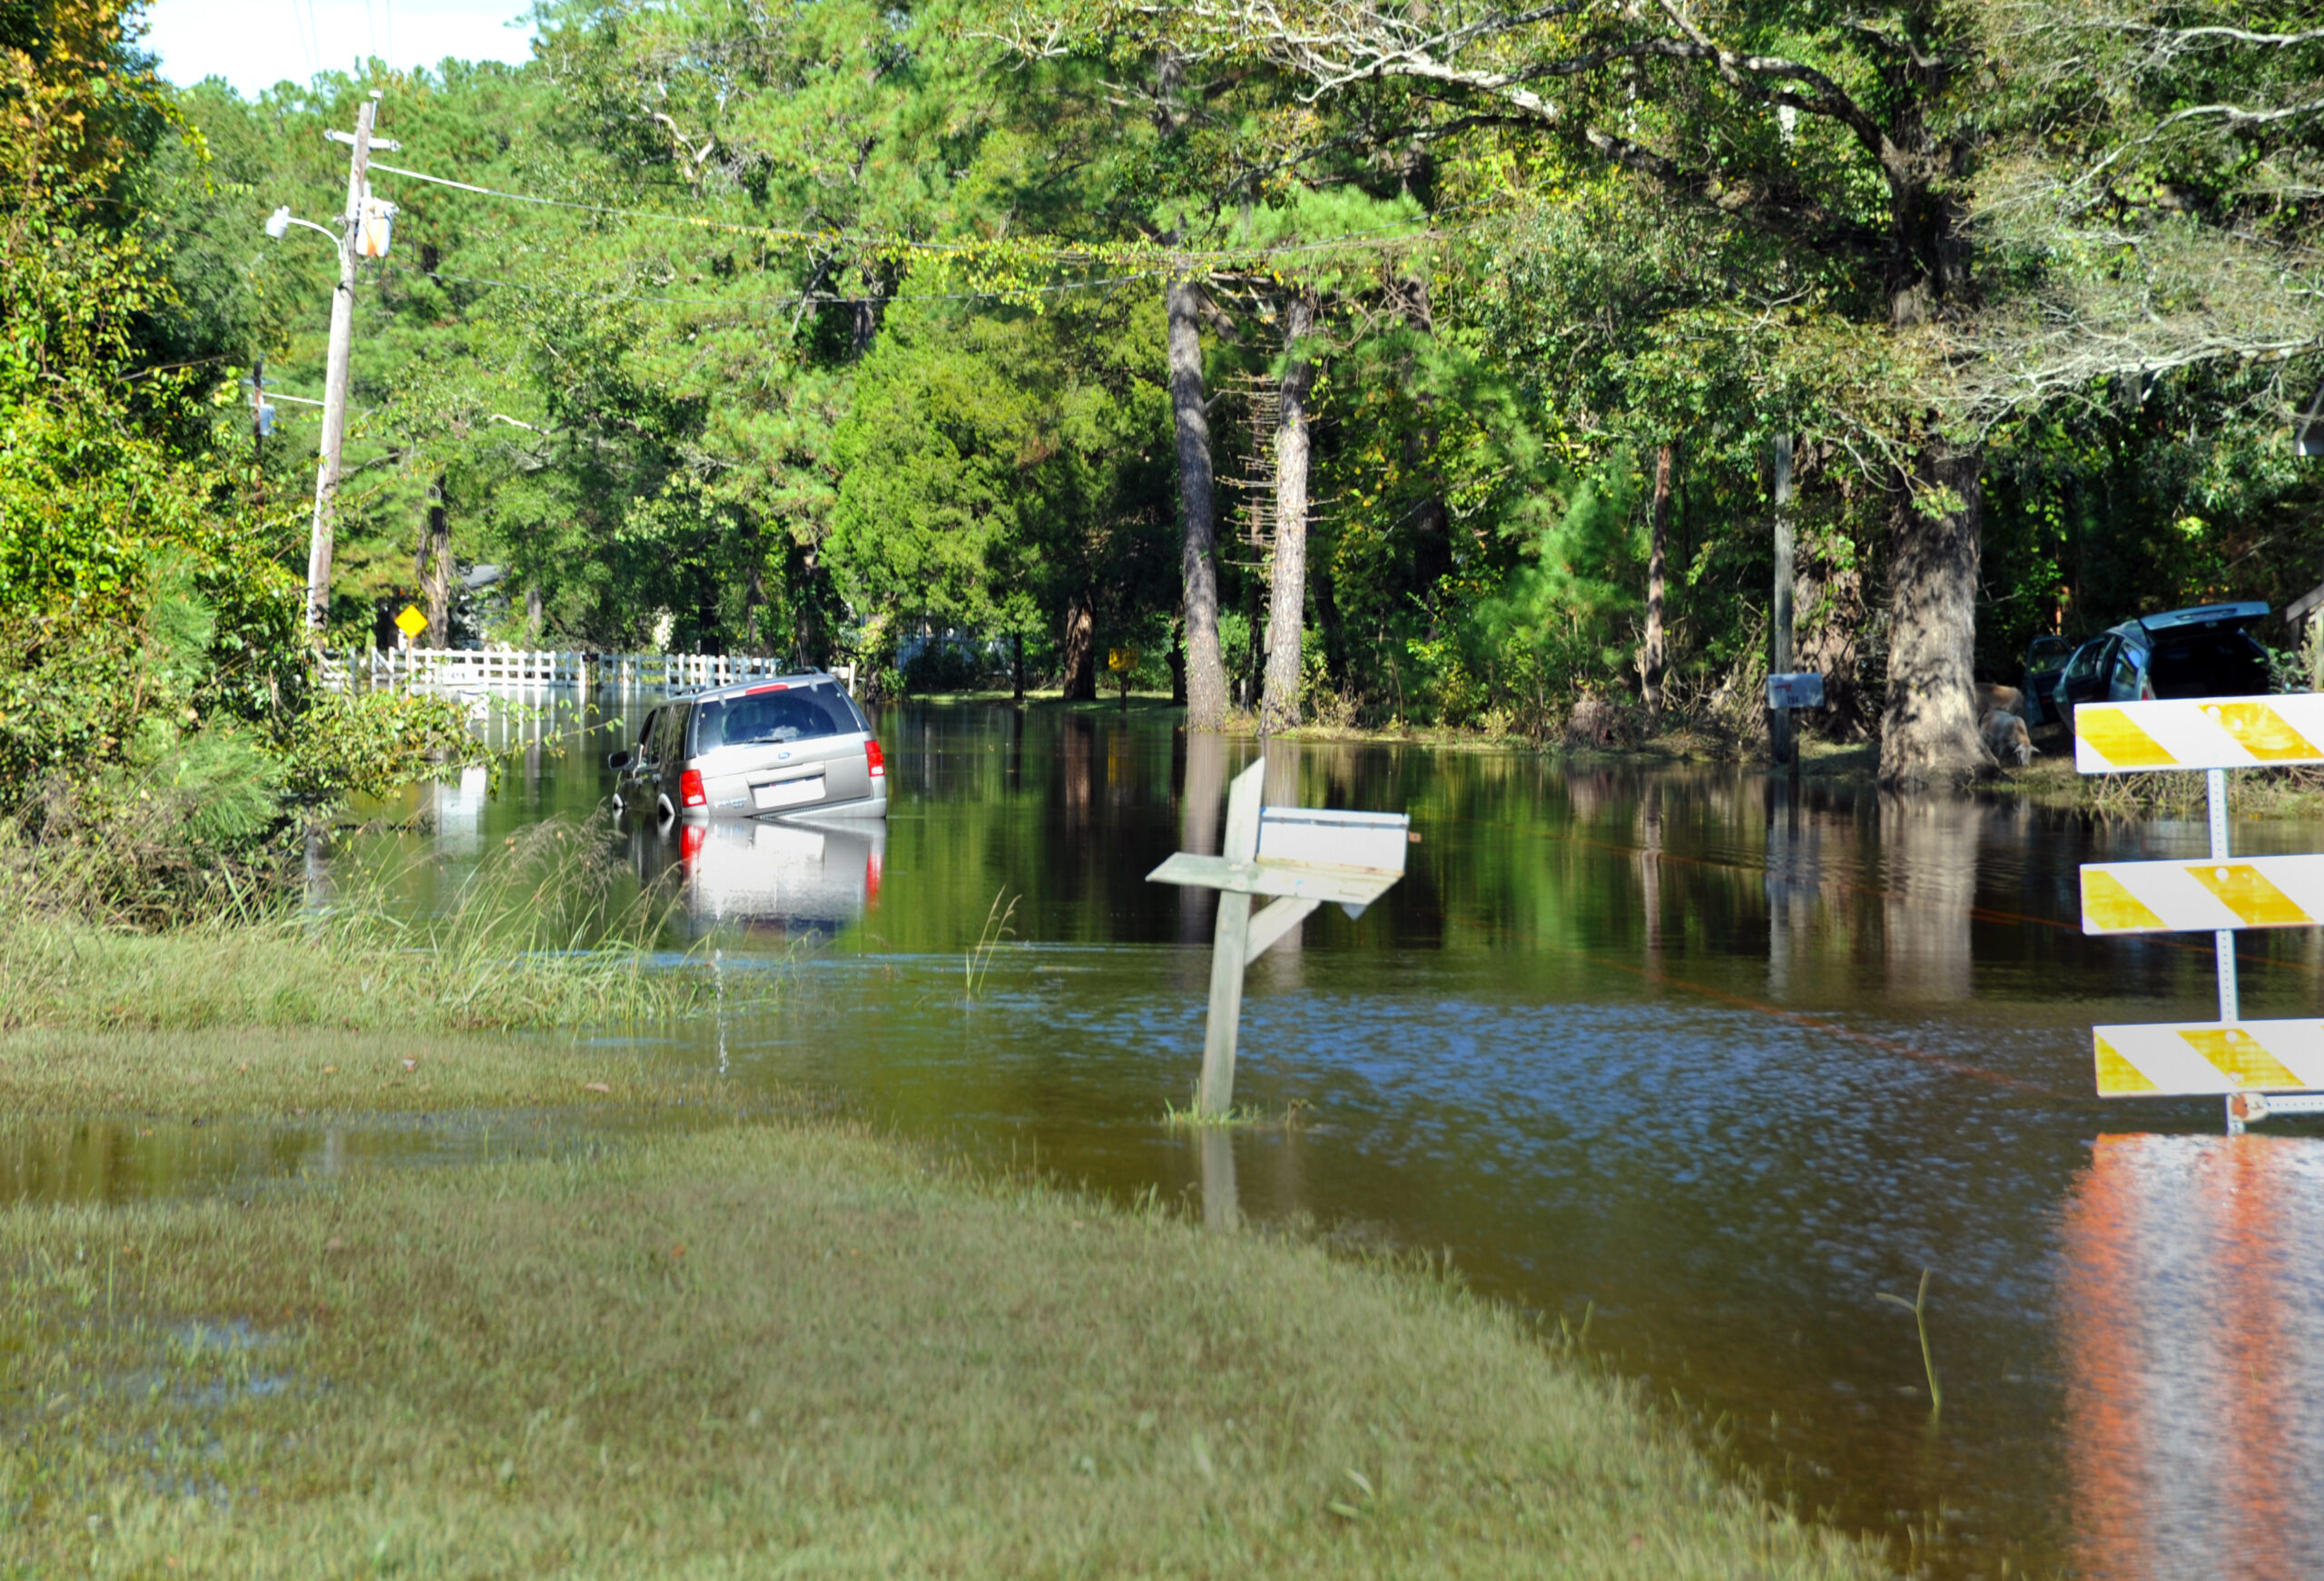
To help mitigate flood damages, many communities across the country participate in FEMA’s National Flood Insurance Program. It allows property owners in these communities to purchase protection against losses from flooding. It also requires insurance for existing homes and buildings located in the 100-year floodplain.
Communities that participate in the National Flood Insurance Program must adopt and enforce floodplain management regulations that meet or exceed the minimum standards and requirements, which include limitations on new development in the floodplain or a minimum elevation at which some houses must be built or raised.
When implementing land-use regulations and flood insurance requirements, communities rely on flood maps prepared by FEMA. Fortunately, after decades of delays, the agency finally updated its maps in March. Before that, the maps had been outdated by up to 30 years, according to Collins.
Still, despite the update, the flood mapping process is time-consuming, research-intensive, and expensive, Collins says. As a result, FEMA has only developed flood maps for 61% of the contiguous U.S., leaving thousands of vulnerable communities without the appropriate information to guide development and other land-use planning activities.
In addition, many of FEMA’s existing flood maps don’t account for ongoing and future climate or land-use change.
“Climate and land cover influence the hydrological flow of an area, so changes need to be continuously reflected in flood maps in order to accurately depict the extent of a 100-year flood,” Collins says.
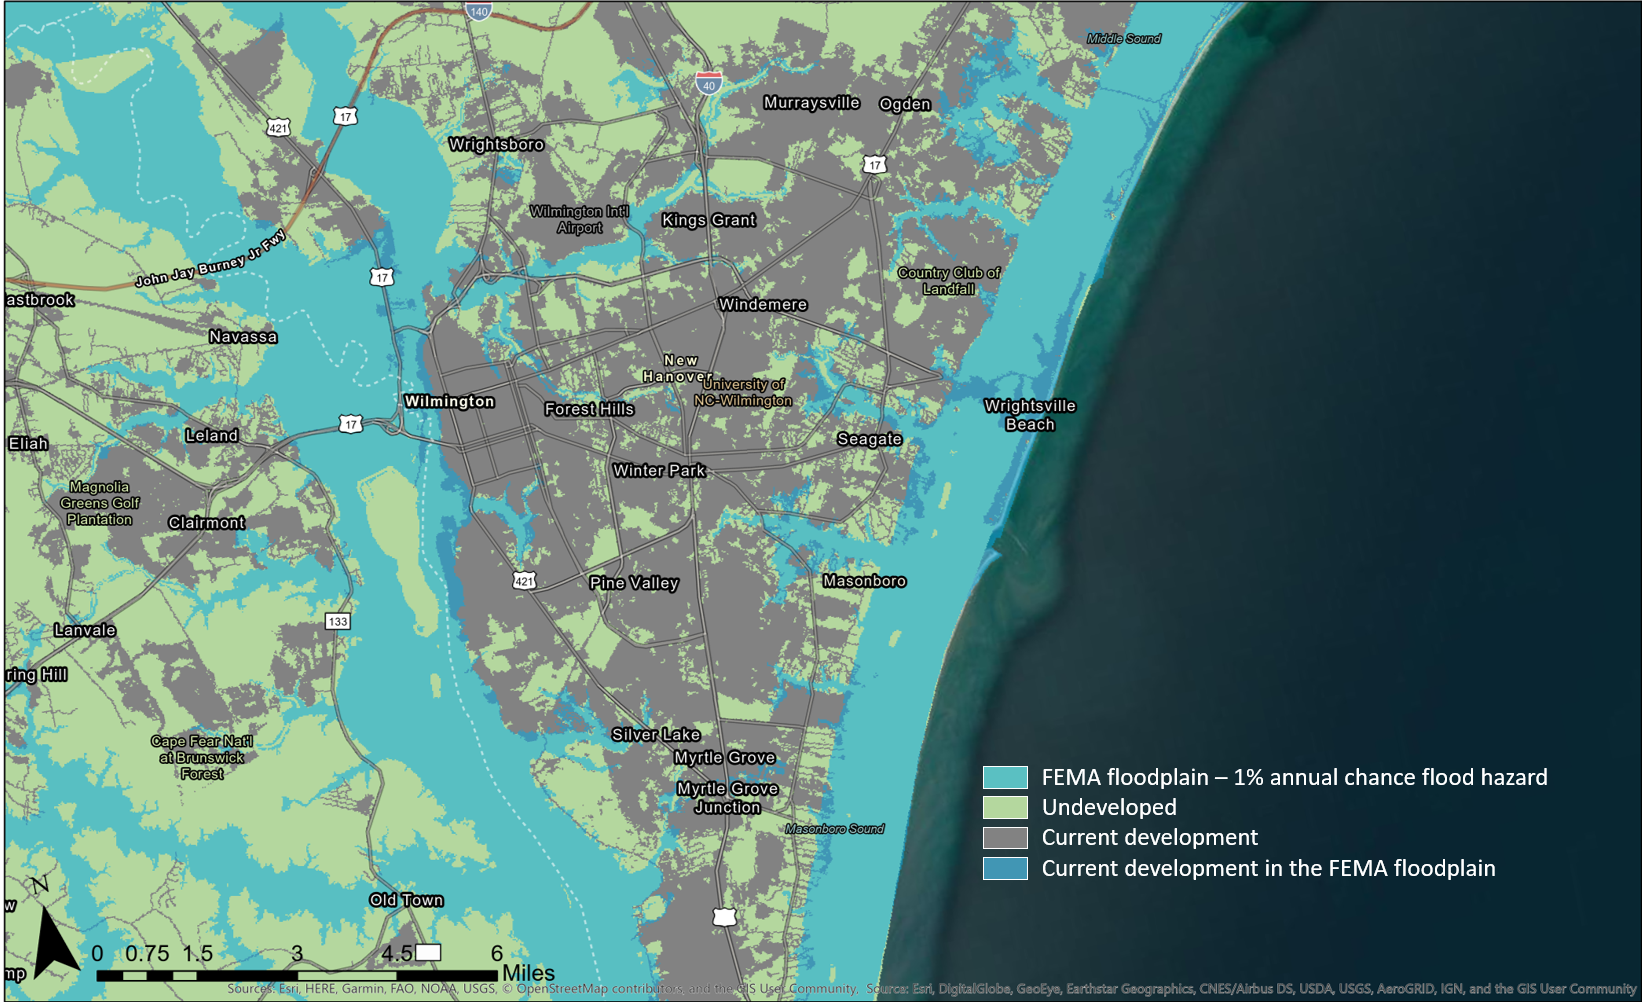
FEMA’s flood maps also oversimplify risk by utilizing static, categorical boundaries for the 100-year floodplain, according to Sanchez. Currently, properties even just a foot outside of the floodplain are considered at low risk of flooding.
Research shows, however, that these properties have a much higher risk of flooding than projected. In 2016, more than 75% of homes in North Carolina whose owners applied for a federal disaster assistance block grant after Hurricane Matthew were located outside FEMA-defined floodplains.
“This categorical representation of flood risk encourages development right outside the floodplain, where property owners can avoid more strict regulations, and this tends to mislead developers and prospective homeowners about their true flood risk,” Sanchez says. “With our simulations, we get a more resolved understanding of risk and how different properties and communities could be affected by flooding now and in the future.”
Beginning in October, FEMA will incorporate additional flood risk variables — flood frequency, flood type, and property characteristics — into the mapping process as part of a new program called Risk Rating 2.0. But to better prepare communities for climate change, researchers like Sanchez and Collins are also creating new risk assessment models.
A New Model: Streamflow Projections and Digital Terrain
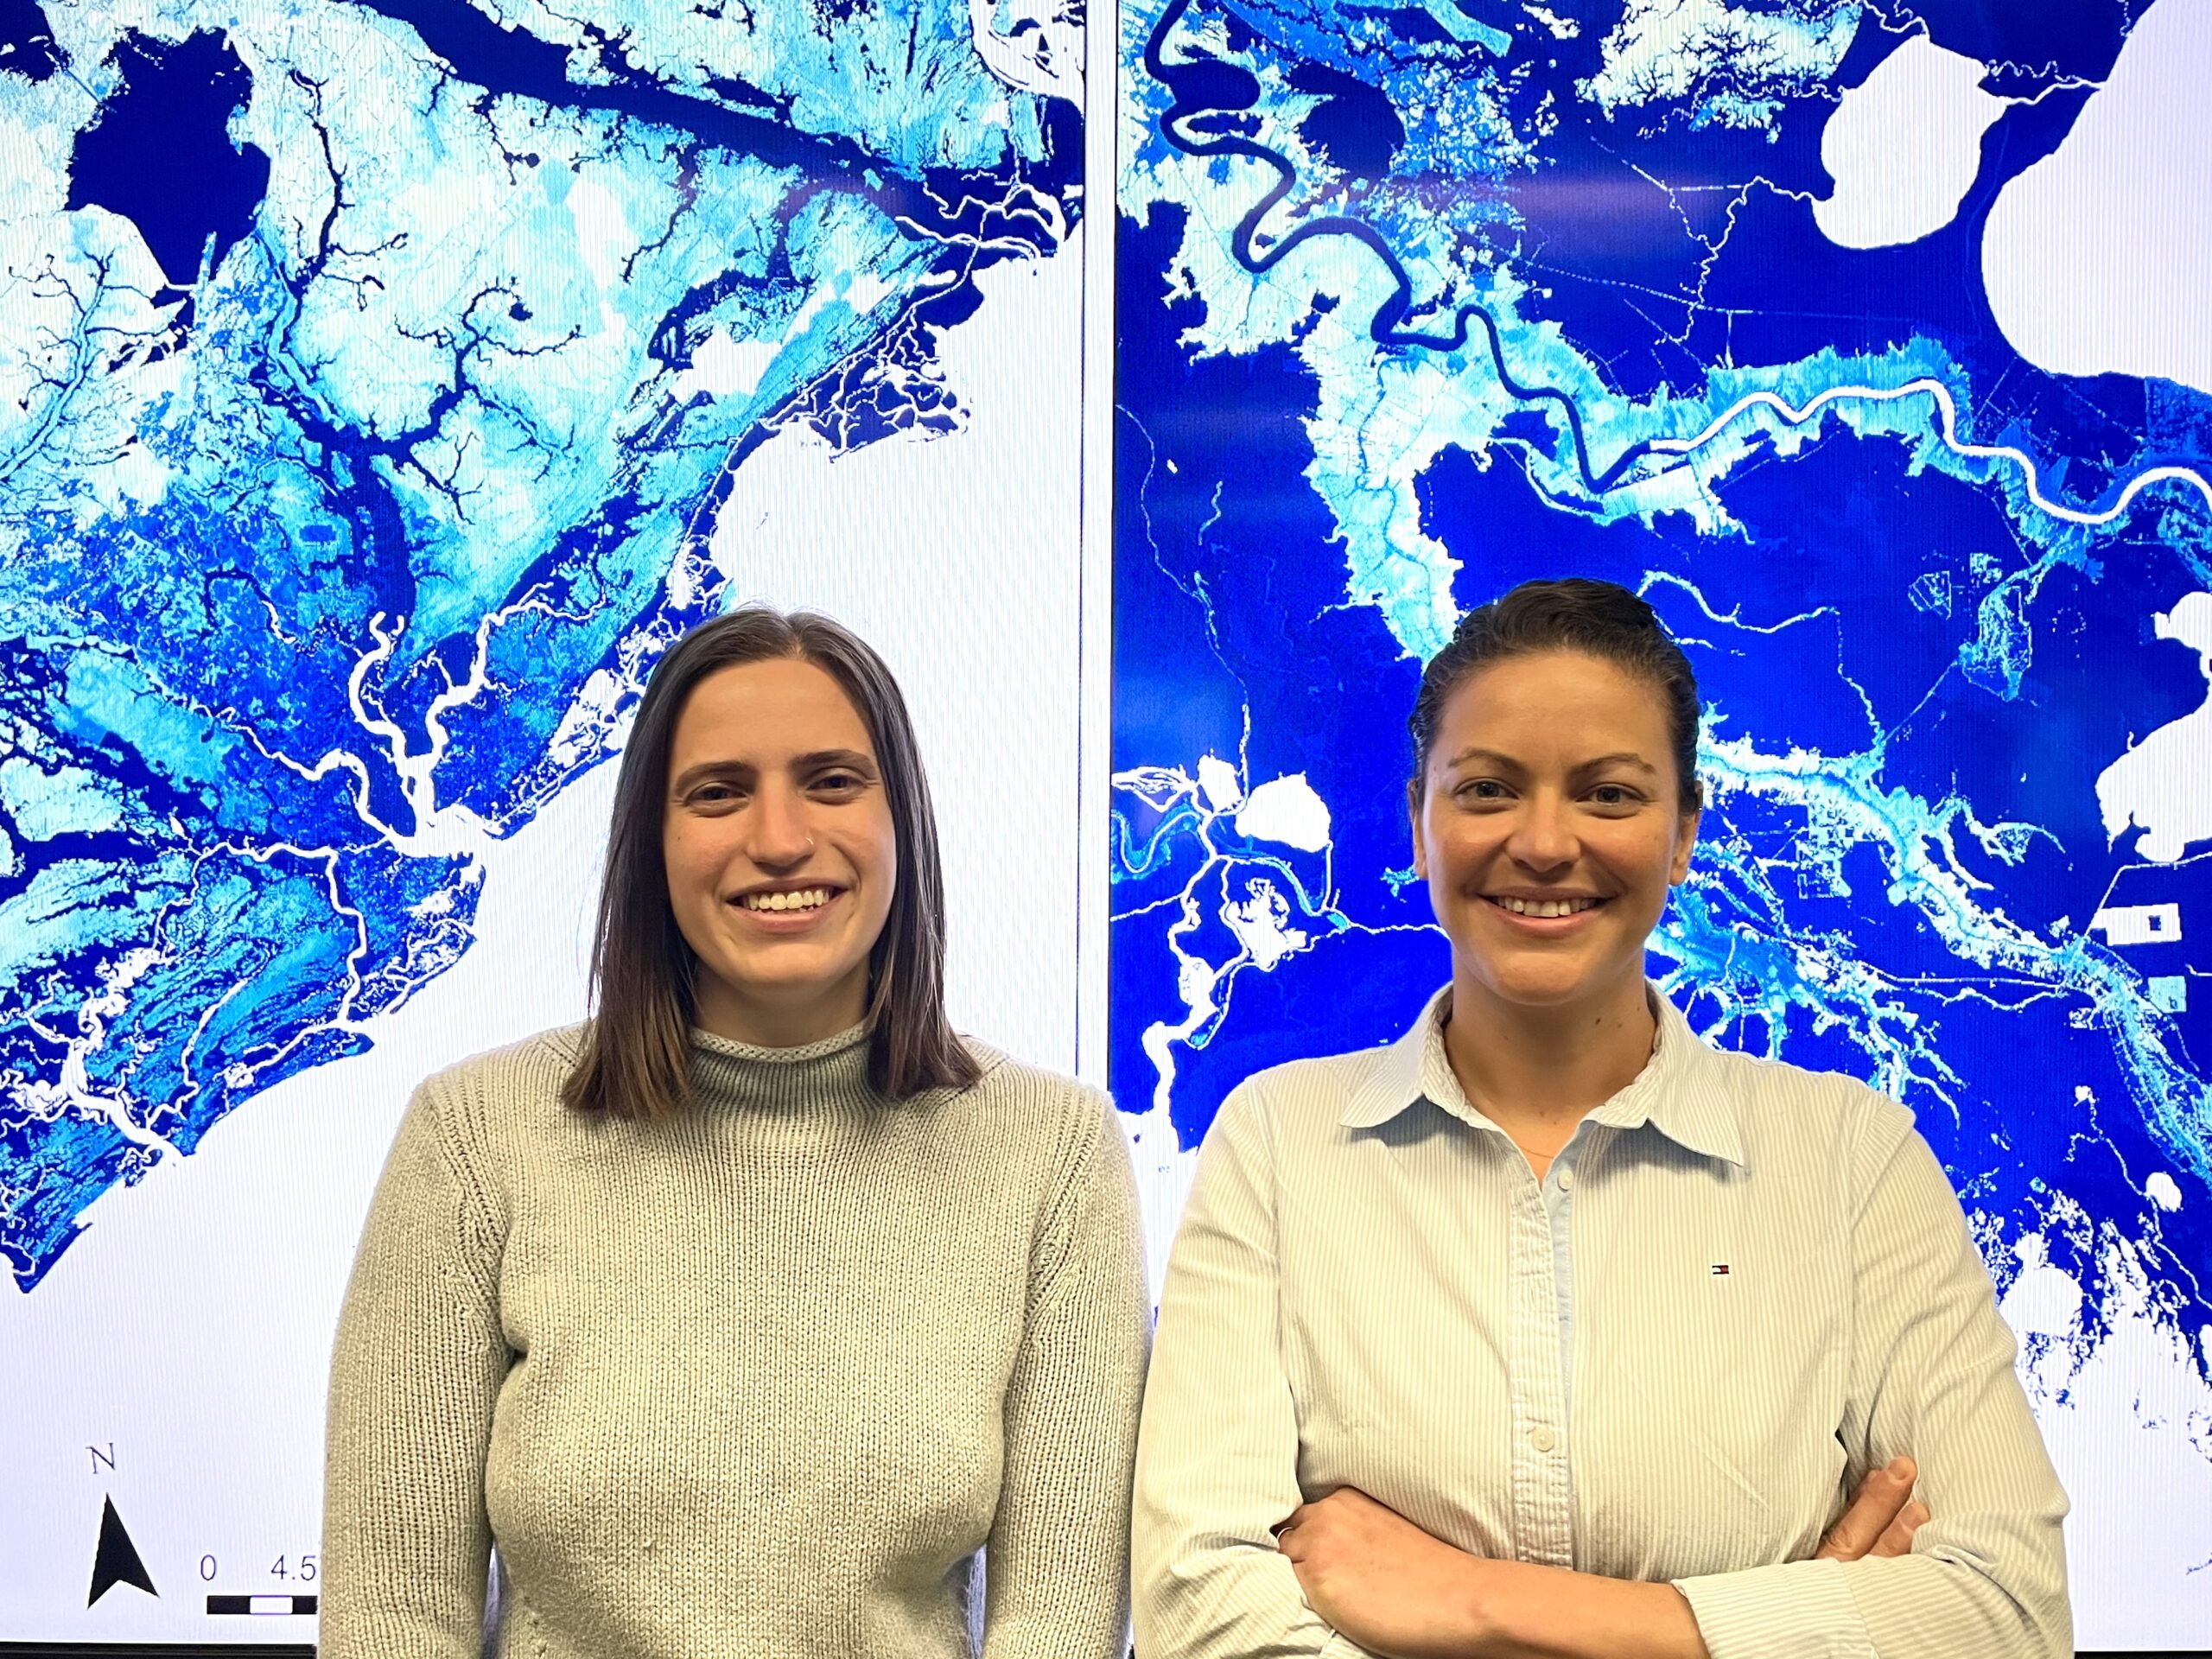
In a novel approach, Sanchez, Collins, and their collaborators are combining streamflow projections for rivers across the contiguous U.S. with a digital terrain model known as HAND (Height Above Nearest Drainage) to create simulations that depict how annual flooding probabilities are likely to change over the next century under a range of climate scenarios.
Since the Industrial Revolution, the burning of fossil fuels for electricity, heat, and transportation has emitted larger concentrations of greenhouse gases into the atmosphere. Although greenhouse gas emissions cause climate change and its negative effects, such as increased flooding, scientists still aren’t exactly sure how much emissions will increase in the future.
To account for this uncertainty, the research team will compare the flood probability results of different levels of greenhouse gas emissions using more than 30 global climate models.
“When evaluating the impacts of climate change, it is important to consider both moderate and high emissions scenarios in order to show the effects of unmitigated climate change,” Collins says. “A higher emissions scenario will likely result in more frequent flood events.”
The research team plans to simulate flooding for each day between 2021 and 2100 and will then aggregate the daily simulations into annual flooding probabilities. Sanchez says the resulting simulations will ultimately offer a computationally efficient and costeffective framework for flood mapping.
Currently, Sanchez and Collins are generating annual flood probabilities for watersheds surrounding Wilmington as a proof of concept, and they plan to establish a replicable and scalable modeling framework to develop simulations for entire regions and sub-regions across the country.
“These simulations aren’t intended to replace FEMA’s flood maps,” Sanchez says “rather to provide another option for landuse planners and developers to effectively estimate future flood risk and damage as the environment changes.”
Collaborators on this project include Ross Meentemeyer, director of the Center for Geospatial Analytics and the Goodnight Distinguished Professor of Geospatial Analytics in NC State’s Department of Forestry and Environmental Resources; Helena Mitasova, associate director for geovisualization at the Center for Geospatial Analytics and professor in NC State’s Department of Marine, Earth, and Atmospheric Sciences; and Adam Terando, research ecologist at the USGS Southeast Climate Adaptation Science Center.
- Coastwatch on Climate Change and Sea Level Rise
- North Carolina Sea Grant’s Funding Opportunities
- Department of Homeland Security OIG 2017 Report: FEMA Needs to Improve Management of Its Flood Mapping Programs
- Preparing for Future Storms, NC Is Working Around One Bad Source of Data: FEMA Flood Maps
lead photo: Kiril Kolev
- Categories:
