And the Rain Came Down
Days before Hurricane Irene hit the state, Spencer Rogers, North Carolina Sea Grant coastal erosion specialist, raced up and down the coast to install wave gauges. He had to keep pace with changing forecast paths. “We put three on Topsail because we were running out of time,” he recalls.
Rogers and a team of researchers deployed 23 gauges before the rapidly approaching storm, starting from his dock in Wilmington and moving north to Jennette’s Pier in Nags Head. North Carolina Sea Grant, University of North Carolina at Chapel Hill and University of Notre Dame collaborated to provide the gauges and old-fashioned elbow grease.
These wave gauges gathered data to determine wave heights during the storm. Researchers and weather forecasters use this to verify their models and storm predictions for Irene.
These devices were specially built for a Florida Sea Grant project. Rogers and UNC-CH’s Rick Leuttich obtained some to use in North Carolina. Each wave gauge contains a pressure gauge housed in about 1 foot of white PVC pipe.
As soon as they could after the storm, Rogers and his team retrieved the instruments. But Irene’s severity brought challenges.
It took Rogers a few days to determine that the gauge on Mirlo Beach had been washed away. With N.C. 12 to Hatteras Island closed and ferry service limited to emergency personnel, it took more time to collect the remaining gauges and get them off the island.
The N.C. Floodplain Mapping Program and the N.C. Geodetic Survey agreed to survey the gauges, starting in mid-September. A survey is essential to collect local information, such as elevation, that would allow researchers to make sense of the data. In addition, the survey would mark the location of these devices so that they could be redeployed in the same place for future storms.
And all the storm data will be on one site. The U.S. Geological Survey, which already has deployed numerous storm surge gauges and put their data online, would incorporate the wave gauge data on their website.
“We’ll have all our data available at one particular spot,” Rogers says. The data will be available to the public, allowing access to researchers, weather forecasters and other interested parties.
As for the missing gauge, Rogers still holds out hope. He acknowledges that it could be anywhere — buried in debris or floating in water. But the instrument has his contact information and perhaps someone might find it. “It is like a note in a bottle,” he says. “If they find it, they will contact us.”
STORM SURVEY TEAMS
While Rogers was waiting to collect and survey his wave gauges, a survey of a different kind was going on.
Immediately after Irene, the National Oceanic and Atmospheric Administration’s National Weather Service weather forecasting office in Newport/Morehead City established three teams to assess the damage. The teams collected data that would help them verify the accuracy of their forecasts for Irene.
“The severity of the storm was the impetus to do this,” says Brian Cullen, senior forecaster. Furthermore, colleagues from other offices were willing to help. “It was a real team effort,” he adds.
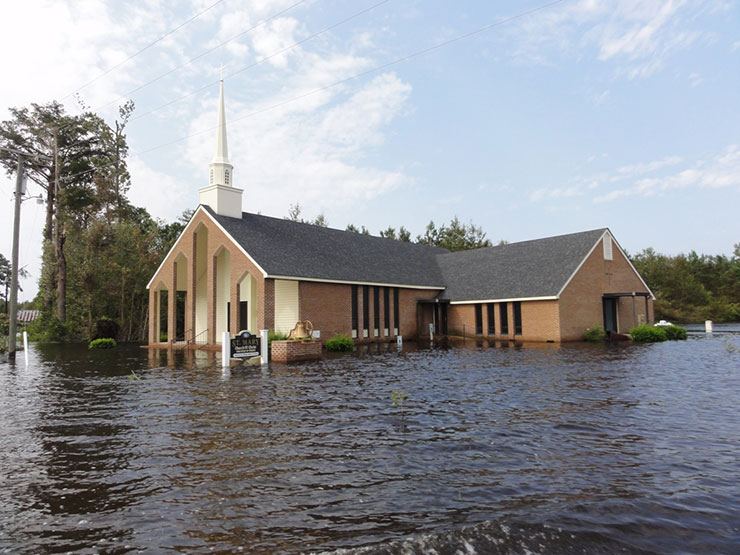
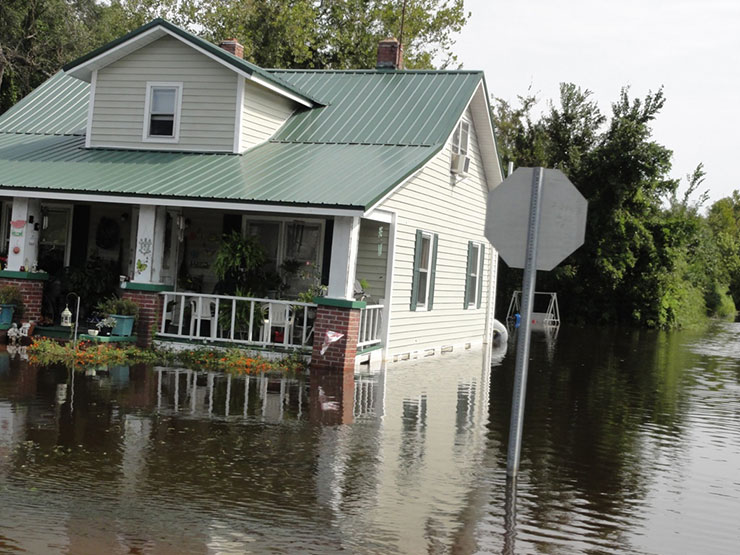
The teams sought high-water marks and debris lines. High-water marks show the height of the floodwaters at a particular location. Debris lines — piles of pine needles, leaves and other materials from the river bank — show how far from the shore or bank the water went and allow surveyors to calculate how high the water rose from its normal level.
Finding high-water marks required some detective work, recalls Nick Petro, Raleigh’s warning coordination meteorologist. Waves and receding floodwaters removed the marks from some buildings. And even though the team started their surveys as soon as possible, residents had cleaned off some markings by the time they arrived.
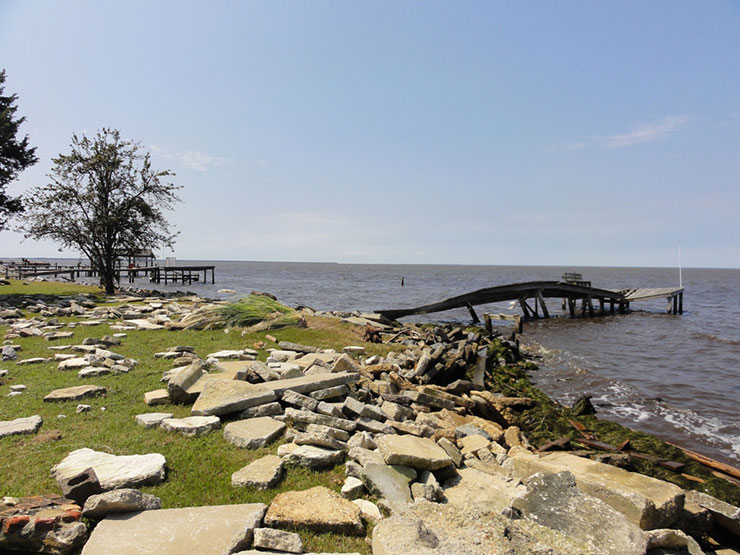
Petro and Mike Moneypenny, also from the NWS in Raleigh, joined Cullen in his survey along the southern shore of the Albemarle Sound and northern Outer Banks. The three men reported one common theme: Many residents had not seen floodwater that high before. In spite of the weather forecasts predicting heavy flooding, the magnitude of the flooding had caught many by surprise.
By the time it hit North Carolina, Irene was a Category 1 hurricane. “That’s not particularly rare,” Cullen says of Irene’s strength. “But from a water perspective, it was unusual.”
Based on a flooding anecdote, Petro estimates that some areas near Columbia experienced a 1.5 hour surge: 45 minutes in and 45 minutes out. “The water came in very quickly,” he notes. “Do not underestimate how significant surge can be coming from the sounds.”
EXPERIMENTAL SYSTEM TESTED
Forecasters sift through information from storm models when building their prediction for a storm. These models anticipate how certain conditions — such as storm direction, rainfall and storm surge — could develop or change. Occasionally, forecasters use data from experimental systems. One such model is the Coastal and Inland Flooding Observation and Warning project, also known as CI-FLOW. This project is led by NOAA’s National Severe Storms Laboratory in Norman, Okla.
CI-FLOW was born out of a need that became apparent after Hurricanes Dennis and Floyd devastated North Carolina. These hurricanes surprised everyone with the destruction caused by storm surge and heavy rain, rather than wind.
“It was quite obvious that better water-level predictions were needed to prevent the loss of life and property,” says Jack Thigpen, North Carolina Sea Grant extension director.
The National Sea Grant Office, NOAA, NSSL and several state Sea Grant programs — including North Carolina Sea Grant — began a collaboration with university researchers to model the water-related effects of a coastal storm. This led to CI-FLOW.
This system predicts total water levels in the Tar-Pamlico and Neuse river basins, where Dennis and Floyd wreaked the most havoc. CI-FLOW takes into account the combined influence of rainfall, river flows, surge, and ocean waves and tides. It is tested when coastal storms approach and its data are available, through a password-protected site, to select people, including NWS staff in North Carolina.
As an experimental system, CI-FLOW depends on good post-storm data to verify its results and determine what changes to its models are still needed. Its predictions before and during the storm should accurately reflect actual conditions, which is where Rogers and the NWS staff come in. The information they collect could be used to build the post-Irene picture and verify the accuracy of CI-FLOW — and other models — for that event.
Prior to Irene, CI-FLOW was used in real time during Earl and Nicole. Before that, it had used archived data.
“Hurricane Irene provided a unique opportunity for the CI-FLOW researchers to demonstrate the capability to routinely predict total water level and inundation in real time,” says Kodi Monroe, who heads the CIFLOW project. She is a Sea Grant-funded researcher at NSSL.
“CI-FLOW is experimental,” Cullen emphasizes. However, during Irene, he noted that some of CI-FLOW’s preliminary information was similar to that from other surge models. He was able to use data from this test system — combined with that from other established models — to develop his surge range prediction for the emergency manager at the U.S. Marine Corps base in Cherry Point.
Cullen points out that CI-FLOW worked in this case because he was providing specific information from the Neuse River, one of CI-FLOW’s focus areas. “CI-FLOW has led to more confidence in our storm-surge forecast in the Neuse,” he says.
TWO SIDES TO A COIN
Moneypenny, a hydrologist, points out one useful outcome of Irene’s flooding: “To end a drought, you need a flood.”
Irene brought heavy rain east of the I-95 corridor. The rain replenished the shallow wells and aquifers in the coastal region. “They couldn’t have gotten it in a better place,” he adds.
By the time the hurricane passed, the severe or extreme drought in the eastern third of the state was gone. A week later, Tropical Storm Lee passed over the state.
“Irene took care of the coast,” Petro says. “Lee took care of the western counties.”
However, the entire state didn’t get an equal share of rain. Rainfall totals went from more than 10 inches to less than an inch within a narrow zone. Even after rain from Irene and Lee, central North Carolina, including the Triangle, remained abnormally dry or in moderate drought in late September. “The piedmont was short-changed,” Moneypenny says.
Irene arrived too late to help farmers in the state. By late August, many crops, including corn, had been declared a loss and plowed under. Replacement crops also were stressed because of the continued lack of water. Flooding from Irene compounded the problem.
“Crops were rotting in the field with their roots submerged,” he adds. Any hopes farmers had of getting a late crop were likely drowned by Irene’s floods.
Many lives and livelihoods, and much property were affected by the flooding that Irene brought to the coastal and estuarine areas. Infrastructure changes along the waterfront and near-water areas, locations that have seen a lot of construction, also magnified the impact of the storm. “We will continue to see more impacts as long as people continue to build,” Cullen says.
“It’s fascinating, as an observer of the weather,” Petro says of hurricanes and the destruction they bring. But his work allows him to give people advance notice of weather dangers.
“My goal is to save lives and property,” he concludes.
For more information, visit the USGS Irene site (water.usgs.gov/osw/floods/2011_HIrene/), National Weather Service (www.nws.noaa. gov) or CI-FLOW (www.nssl.noaa.gov/ciflow/). To see the state’s latest crop report, go to: www.ncagr.gov.
This article was published in the Holiday 2011 issue of Coastwatch.
For contact information and reprint requests, visit ncseagrant.ncsu.edu/coastwatch/contact/.
- Categories: