CURRENTS: Data Surge: Better Storm Records Will Improve Predictions
The National Sea Grant College Program is celebrating its 50th anniversary through March 2017. The monthly theme for May 2016 is Community Resilience. To recognize North Carolina Sea Grant’s long-time role in resiliency efforts, Spencer Rogers offers this essay. Rogers has been North Carolina Sea Grant’s coastal construction and erosion specialist since 1978. He serves on the science panel that advises the N.C. Coastal Resources Commission, and has participated in many state, regional and national research and outreach efforts.
North Carolina Sea Grant is pleased to continue to be a partner in national efforts to improve storm-surge data gathering and understanding. Those efforts are advancing thanks to the increased attention from the U.S. Geological Survey, or USGS, to storm surge in and following Superstorm Sandy in 2012.
USGS efforts to take the lead for the coastal storm-surge/wave-elevation measurements are greatly appreciated. The upgrade to faster wave gauges is a significant step forward. I am now out of the gauge rapid-deployment business. But I will continue to help partners identify prime deployment locations during storms — and will continue the recordkeeping in my own backyard near the Intracoastal Waterway in Wilmington.
Measurements of water levels and wave heights in specific storms obviously are important as part of a storm record. But that data also will be used in models for forecasting impacts of future hurricanes or other coastal storms that threaten our coasts.
In North Carolina and other states, these data are used in emergency management and planning, such as floodplain mapping. Those records also are key factors in predictions that are used in flood-resistance designs for new buildings and retrofitting of existing structures.
EARLY EFFORTS AND STORM RESPONSES
My interest in wave gauges goes back to 1978. At that time, they were too expensive to purchase in useful numbers.
Even 20 years ago, local, state and national officials did not have precise measurements of the water flow during storms. Rather, they relied on “watermarks” as historical records.
That system had at least two major drawbacks, as Sam Houston of the National Oceanic and Atmospheric Administration’s Hurricane Research Division and I described in a paper presented at a conference of the American Society of Civil Engineers in 1997. The paper was in response to Hurricane Fran just the year before.
We described common errors in post-storm watermark surveying — and recommended installation of storm-surge/wave gauges at key points in advance of specific storms.
The first problem was that no single agency was in charge. Nationally, many folks were collecting storm-related water data, including USGS, the U.S. Army Corps of Engineers, the National Weather Service and various researchers at state agencies and universities, including Sea Grant program staff and researchers.
No single system or protocol was used to measure watermarks, or to maintain the records. Also, the marks recorded the highest water during a storm. While that is good information, it is much better to identify the ebbs and flows of storm surge and other water movement during and after storms — be they named or not.
While watermarks note the peak at the worst of the storm, we do not know what time they occurred. (My home includes marks from Hurricane Fran in 1996 and Floyd in 1999 — along with a handwritten record of approximate timing.)
If we use watermarks with errors in storm-surge models, then we are building errors into those models. Gauges, on the other hand, offer a hydrograph that is needed to calibrate the models.
Originally, the National Ocean Service’s tide gauges were designed for navigation. They were not optimized to survive hurricane conditions. In the worst conditions, they often failed. Their daily water records were not helping us in storms.
Beginning with Hurricane Rita in 2005, USGS began extending its century of work in measuring streams and rivers to deploying pre-storm gauges.
My focus on gauges started through a collaboration with Andrew Kennedy. While a researcher at the University of Florida, he designed units that would be dropped from helicopters to measure offshore waves, as part of a Florida Sea Grant project in the early 2000s.
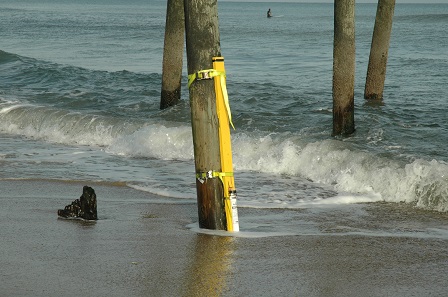
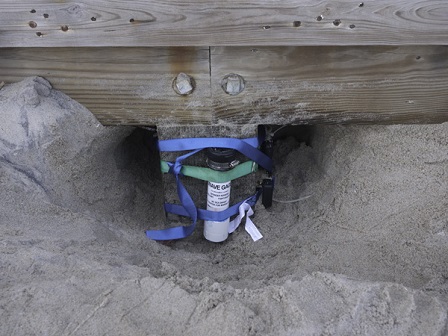
I liked his design but I saw a more direct need to measure waves and storm surge near buildings. So we made arrangements to obtain and adapt them for use in North Carolina — to have them on call when a storm threatened. The goal was to place these gauges at predetermined locations based on the storm’s track.
At one point, the USGS gauges would cost up to $50,000 each, but officials realized that as technology improved, the prices were dropping — down to $1,000 or even $500 each for Kennedy’s designs and our adaptations that were funded by a North Carolina Sea Grant minigrant.
We let USGS know what we had in hand. Rick Luettich, director of the University of North Carolina at Chapel Hill’s Institute of Marine Sciences, or IMS, also had gauges for his research. North Carolina Sea Grant started deployments in 2006, with several years in which we did not have severe storms to test the process.
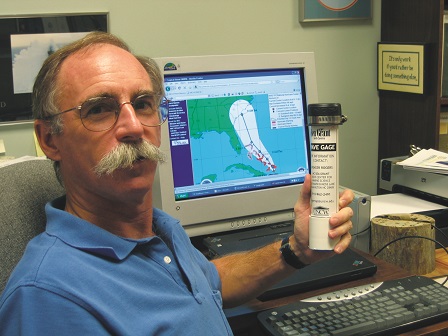
But when Irene threatened North Carolina in 2011, the three groups — Sea Grant, IMS and USGS — were ready to cover deployment in different parts of the state. Kennedy, now at the University of Notre Dame in Indiana, came down to join our team (see map). This was a great advance over Hurricane Isabel in 2003, when we really needed the gauge-based measurements, but had to rely on watermarks.
After Sandy — first designated a hurricane, then a superstorm — hit the East Coast in 2012, USGS was tasked with collecting storm-surge and other water data. Based on our experience, we encouraged them to move from slower stream-flow measurements to the wave gauges for storm surge.
At the time, the USGS storm-surge gauges would only sample every 30 seconds, comparable to their century of stream-gauge recording history. Unfortunately, more accurate wave sampling requires about one-second sampling. I admit that I sounded a constant refrain at every opportunity I could during discussions among national partners: We need wave gauges that sampled faster.
USGS agreed and was able to start purchasing wave gauges to meet nearshore and inshore needs. For Hurricane Joaquin in 2015 and a 2016 winter storm, we saw successful deployments.
As North Carolina is within a primary area for USGS, I no longer will be dashing about to deploy gauges before storms. I have kept some of our North Carolina Sea Grant gauges for ongoing research and outreach. Others have been shared with the Mississippi-Alabama Sea Grant Consortium for a project on Dauphin Island, which was affected by hurricanes such as Katrina and Ivan.
ONGOING COLLABORATIONS
Now, with equipment and deployment much better refined thanks to USGS, I see a key issue to address: How to optimize useful data collection. That leads to defining “useful.” I suggest the most important applications of these gauges are likely to be ones that lead to:
- A better understanding of coastal flood damage at the building and community scales, based on observed damage and other impacts.
- More accurate modeling to hindcast the conditions causing damage and to predict future coastal storm conditions at the building scale.
- More accurate predictions of building/community damage when a storm is pending.
- Better design guidance and implementation by communities to ensure future development is sustainable, one building at a time.
To accomplish these objectives, we need:
- Storm-surge/wave models at the building scale.
- Bathymetry/landform elevations and storm-driven changes for the models.
- Existing building design details, particularly location, foundation details and elevation.
- Post-storm building/community damage analysis to evaluate what worked or failed.
- Storm-surge/wave data to calibrate all of the above.
NOAA and USGS have significantly improved data collection for pre- and post-storm bathymetry/landform elevation data. Those efforts are leading to better storm-induced change modeling. But detailed pre-storm building and community design data remain rare. Damage analysis has focused on individual buildings — and seldom has been expanded to the community scale.
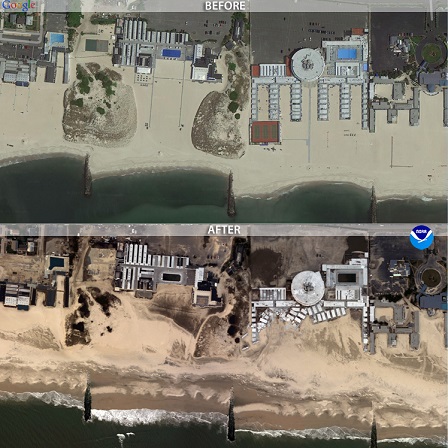
Kennedy and I have been working on community-scale issues using USGS gauge data from Hurricane Ike in 2008. With funding from the N.C. Floodmapping Program and others, we are incrementally increasing the scale of building analysis on the Bolivar Peninsula in Texas.
Prior community analysis assessed about 80 buildings after Hurricane Opal. After Ike, we covered about 400. More recently we looked at about 1,700 buildings, and anticipate evaluating 5,000 buildings in our current work. What we have learned so far includes:
- Waves — or even a single wave — on a building are far more damaging than commonly assumed. Smaller-breaking wave heights and lower wave elevations relative to the building elevation have been shown to cause quicker failures than initially thought. Earlier wave-tank testing suggests that wood-frame building failure is likely when breaking waves exceed 1.5 feet at impact. Field evidence suggests that piling-elevated building failure occurred in Ike when less than 1 foot of the crest of a 6-foot wave hit the lowest horizontal foundation members.
- Post-storm surge modeling has improved significantly to evaluate flood damage.
- Post-storm wave modeling is relatively accurate near the ocean, but quickly loses accuracy moving inland across a flooded, developed coast.
- Waves on backsides of barrier islands and along bay shorelines are relatively unknown and poorly predicted.
- FEMA storm-surge modeling has been significantly improved with ADCIRC, a coastal circulation and storm surge model developed by Luettich and colleagues. But wave height, runup, regeneration and erosion models are particularly outdated. This results in unrealistic coastal flood-hazard mapping, generally underestimating threats near the ocean but overestimating them in more sheltered bay conditions. Based on all of the above:
- We need wave-gauge profiles across low-elevation islands flooded under extreme water levels. Concentrated, across-island gauging is needed in at least a few locations.
- Post-storm collection of building foundation and elevation data usually is difficult, expensive and/or impossible. USGS wave data will be more useful where building data are easier to obtain.
The N.C. Floodmapping Program has surveyed existing data for 5 million buildings in river and coastal floodplains in North Carolina. As the state is a likely target area for future storms, I support concentrating USGS wave gauges in North Carolina across low-elevation barrier islands that are likely to be inundated, and along mainland shorelines of bays and sounds.
No comparable building data exist elsewhere. All we need is to document the surge and wave conditions. With that information in hand, it will be easy to justify and organize quick-response building-damage surveys based around the gauge arrays, at the community scale.
This article was published in the Spring 2016 issue of Coastwatch.
For contact information and reprint requests, visit ncseagrant.ncsu.edu/coastwatch/contact/.
- Categories: