CURRENTS: Muddy Waters: Defining the 100-Year Flood
Let’s make a bet. There is a bag of tiles, numbered from one to 100. If on one try you can pick out the “99” tile, you can stop reading this story.
Since you average just a 1 percent chance of this happening, it’s pretty safe to assume you hypothetically are still following along.
This event has a 1-in-100 chance of happening — but it would be misleading to say it would happen only once every 100 tries. It is entirely possible to select a tile, put it back in the bag and reselect the same tile the very next turn.
Unfortunately, this chance of recurrence also holds true for the very real stakes involved in predicting floods and coastal storm surges.
When used properly, the term “100-year flood” really means there is a 1-in-100, or 1 percent, chance of a flood occurring in a certain area in any given year.
Given that probability, that flood is likely to occur, on average, once every 100 years over an even longer period of time. Similarly, you would call a flood with a 1-in-500, or 0.2 percent, chance of occurring every year a “500-year flood.”
We often muddy the waters and misuse the phrase, giving any big flood the 100-year flood label. Or, we wrongly conclude an area experiencing no floods over a century surely isn’t within the 100-year floodplain.
So how did a statistical average become the common measurement for judging rising waters?
Quantifying risk with statistics goes back centuries, but this particular problem has roots in the 1960s. The National Flood Insurance Program needed to develop a benchmark level considering both the level of protection and the cost of compliance that could be applied to communities across the country. They struck that balance by establishing the 100-year flood standard, also referred to as the “base flood.”
How is this base flood determined? It’s a matter of looking at the past to forecast the future.
FINDING THE FLOODPLAIN
Risk distributions rely on historical recordkeeping, so the longer the records the better the predictions. The longest-running tide gauge in North Carolina has been active for 81 years, but only a few gauges have continuously collected data — the newest gauge for only 13 years. Most river gauges have been around a little longer than those on the coast.
Scientists apply models to the short-term existing data to approximate the history we do not have. Then, they test the model outputs against real-life events to verify their accuracy.
In New Hanover County, for example, the storm-surge model closely predicted Hurricane Fran in 1996, roughly a 100-year flood. Hurricane Hazel closely matched the same water levels in 1954.
Now observed through 2017, just two 100-year-equivalent events in New Hanover County have happened within a span of more than 63 years — indicating the modeling predictions are in the right ballpark.
However, when the press reports a river reaching a 1,000-year flood, or when a property owner in Avon observes his house flooded by the “third annual Storm of the Century,” something is amiss. Either those locations were very unlucky, or more likely, our modeling was inaccurate.
Eventually, the new flooding data will enter the historical record and improve the accuracy of the models. This work is done by the North Carolina Floodplain Mapping Program, a formal partnership between the state and the Federal Emergency Management Agency, created after Hurricane Floyd in 1999 to modernize the state’s floodplain maps.
In addition to producing updated, digital flood-hazard data, the program is tasked with maintaining and updating the floodplain maps. As more data are collected, or floodplains change due to nature or development, they can re-evaluate flood frequency. You can view current maps and learn more about the program at ncfloodmaps.com.
ACCUMULATING ODDS
Whether your home or business lies in or out of the 100-year floodplain, it’s important to understand your risk. With enough rain or a big storm surge, almost any location can flood. And the chances of flooding increase the closer you get to the water source, as well as the longer the period of time you consider.
Let’s reconfigure that original wager: What if you got 30 tries to pull out a specific numbered tile, with the only stipulation being that after each turn the chosen tile is returned to the bag?
The odds may not be in your favor but they are much better: You now have about a one-in-four chance of hitting the mark.
The decisions we make in designing buildings last for the lifetime of the house — an estimated 70 years for wood-framed buildings in the Southeastern United States. Most of us don’t build or buy a house expecting to occupy it for just one year, and many of us choose to finance our home-sweet-home with a conventional 30-year mortgage.
If you have a 1 percent chance of a flood occurring each year, the resulting probability of experiencing the 100-year flood during a 30-year mortgage compounds to 26 percent. Over the 70-year average life of the house, the likelihood of a 100-year flood increases to 51 percent — the flip of a coin. Does it get wet? Heads or tails!
Floodplain managers and insurance agents use the 100-year floodplain to determine construction standards and flood insurance premiums. Flood safety is one of several hazards addressed in building codes. Compared to standards for wind, fire and earthquakes, the building requirements for floods are actually the least protective in statistical terms.
The original national standard for wind was based on a local 50-year wind speed with additional “safety factors” added to better ensure damage would not occur within those 50 years.
Recent changes to the standards moved some of the safety factors into the wind-speed maps. Most new buildings now are designed for a minimum 700-year wind speed — hospitals for at least a 1,400-year wind speed.
For life-safety purposes, the building standards require a more stringent 2,475-year recurrence period for earthquakes, and a roughly 3,000-year rate for fire safety. These projections generally extend well beyond the expected lifetime of a building, but were judged to be necessary for human safety should the threat occur.
BETTING THE HOUSE
In many cases, flood damage also can occur with water levels below the 100-year prediction because the building codes usually address floodwater reaching the lowest floor elevation of a house. Everything below the floor — insulation, ductwork and wiring — is susceptible to flooding below the standard.
Building above the 100-year flood standard is the best way to improve your odds of staying dry now, and in the future. Using freeboard — additional height above the base flood elevation — is a common option for new and existing homes to achieve a greater margin of safety and reduction in insurance premiums.
Adding up to 4 feet of freeboard can reduce National Flood Insurance Program premiums up to 70 percent in some areas. Many coastal communities in the state already require the use of freeboard as a locally implemented safety factor.
Despite our efforts to plan and prepare for floods, the waters will surely rise again. You can bet on this.
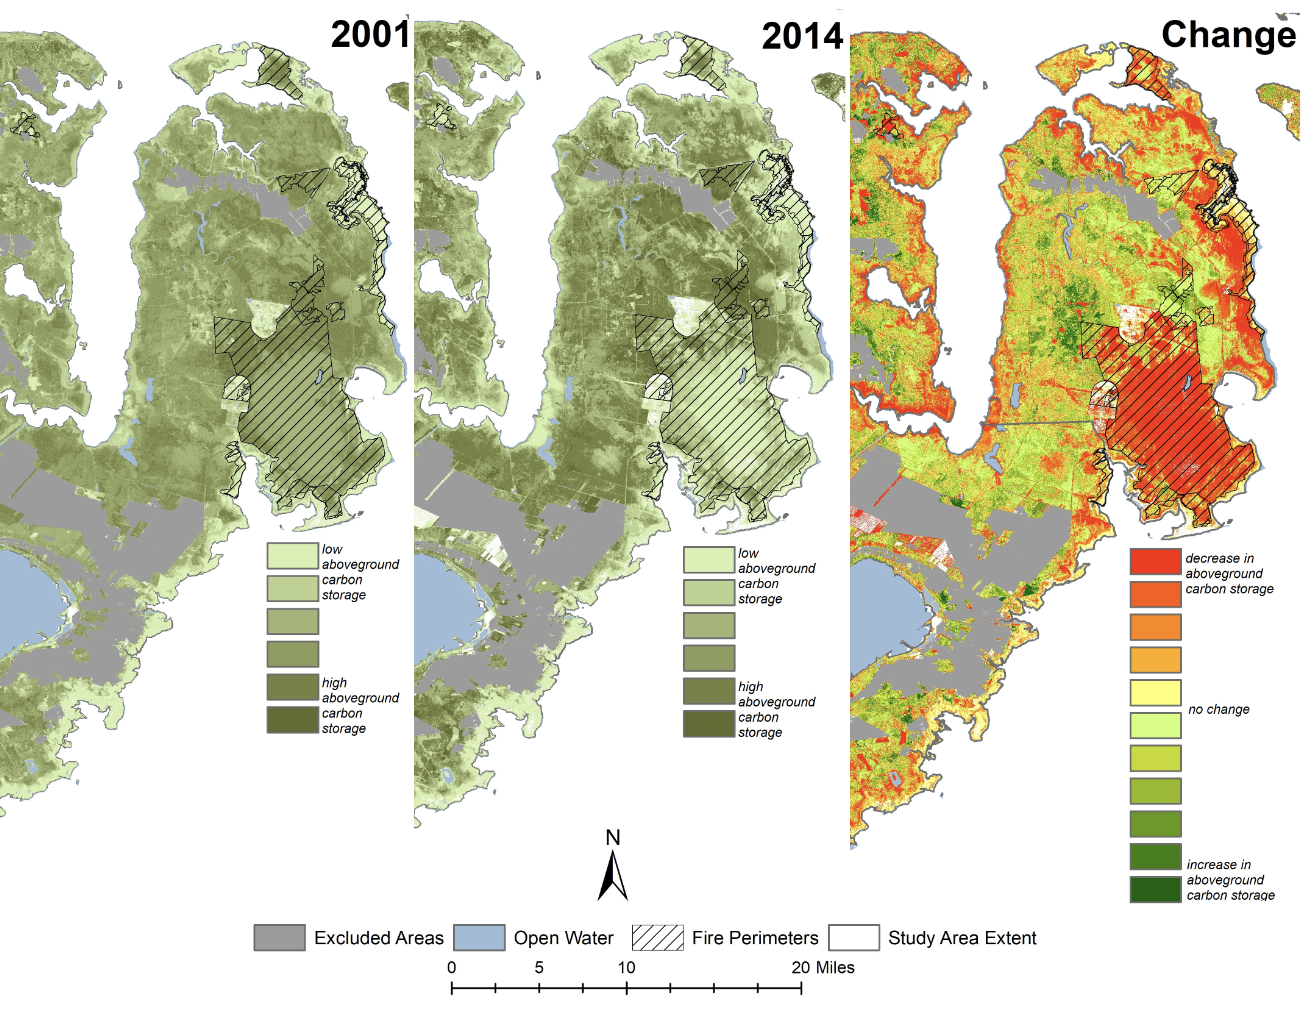
North Carolina Sea Grant works closely with coastal communities to effectively prepare for and improve resilience to natural hazards like floods. In Hyde County, for example, Sea Grant partnered with the county, Georgia Sea Grant, the University of Georgia’s Carl Vinson Institute of Government and UGA Marine Extension Service to study community resilience and adaptation options for flooding. The final residents’ flood-preparedness guide, as well as a video created for Hyde County about flood planning, can be viewed at ncseagrant.ncsu.edu/floodguide.
This article was published in the Spring 2017 issue of Coastwatch.
For contact information and reprint requests, visit ncseagrant.ncsu.edu/coastwatch/contact/.
- Categories: