SENSING THE FUTURE: A New Technique to Monitor Water Quality

A salt marsh is ever changing. Here it behaves like a stream, there a wetland. Now it is salty, later it is brackish. Tides, storms, wind and evaporation all act upon marsh systems, making them highly dynamic and difficult to study.
Scientists know that marshes provide numerous ecosystem services such as shoreline stabilization, wildlife habitat and nutrient absorption. And as these benefits become better understood, there has been a greater push for restoration of marsh systems. For example, in areas between agricultural lands and water bodies, marshes are being used to absorb some of the fertilizer running off the farmland. But with all of the changes happening in a marsh, it has been difficult to quantify how much fertilizer they actually remove.
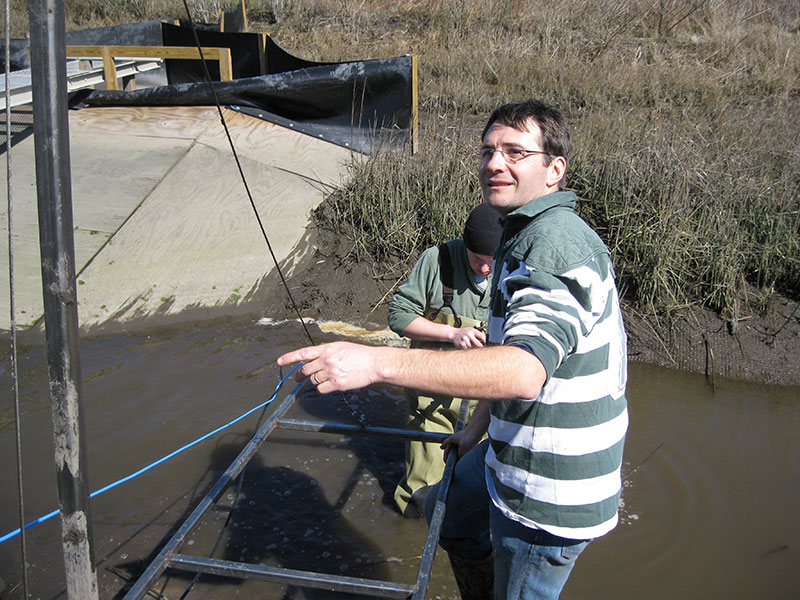
A new technique developed by agricultural engineer François Birgand and his team at North Carolina State University could change how water quality is monitored. In a paper published in the journal Limnology and Oceanography: Methods, Birgand and his team describe an automated technique they developed to monitor water quality in tidal marshes. The method gives researchers a high-resolution view of changes in water nutrient levels by using sensors to take readings at 15-minute to 1-hour intervals. North Carolina Sea Grant contributed funding to the project, as did the North Carolina Water Resources Research Institute of the University of North Carolina system
“François’ team has filled a very important data gap,” says John Fear, who is deputy director of both programs. Fear notes that scientists have had the capability to measure the physical properties of water such as temperature, salinity, pH and flow at 15-minute intervals for decades. What has eluded them, he says, has been the ability to routinely and cheaply measure the nutrient concentrations of water at these time scales. This disconnect in the sampling frequency between the two sets of data has made it difficult to fully understand and model the short-term, episodic-driven events that occur in these marsh systems.
“The novel sensor package developed by François’ team has solved this problem, greatly increasing our ability to understand the nutrient dynamics in these critically important marsh systems,” he adds.
Old and New Methods

Current techniques for studying how marshes process nutrients often involve taking a limited number of water samples and extrapolating data to show how a system functions over longer periods of time. The problem with this method, according to Birgand, is that short-term fluctuations and unpredictable events, such as storms, are not quantified in terms of their contribution to nutrient fluxes within the system.
“If you are measuring every two months for 50 years, you will get the true tendency,” he says of the marsh system. “But if you are measuring every two months over the next three or four years, in my opinion, the chances for your conclusions to be wrong are very, very high.”
The technique Birgand and his colleagues are developing gives researchers a clearer view of what is happening in the water without having to monitor it for 50 years. It combines using “UV-Vis” spectroscopy — a technique that shines ultraviolet and visible light through a water sample and records how it is absorbed — with a specific statistical technique.
Birgand was inspired by a new generation of UV-Vis spectrometers that are manufactured to monitor water quality. These metal tubes, nearly two feet long and two inches in diameter, are made to be submerged where they take measurements and provide data in place. Wastewater treatment plant managers put them near their intakes to understand the quality of water coming into their system. State agencies use them to monitor drinking-water reservoirs. A few studies have looked at their use in the ocean and in streams, but none have tested their use in tidal marshes.
Birgand and his team saw the sensors as an opportunity examine how water quality changes at 15-minute intervals in a restored salt marsh. As part of the testing, the group developed a method that expands upon the sensor’s advertised capabilities. The journal article details how the method can be replicated in other systems so that researchers can get a nearly continuous estimate of changes in water quality.
According to Matthew Cohen, a researcher at University of Florida who uses the sensors to study spring-fed streams, the use of statistical methods for studying water quality opens up many new opportunities.
“That’s where François has made a real contribution,” he says. “You can use it potentially for things like phosphate or turbidity or chlorophyll, where the algorithm is not mechanistic, where it’s more statistical.”
Expanding Capabilities
Water constituents such as nitrate, dissolved organic carbon and total suspended solids have unique absorbance signatures that UV-Vis spectrometers can detect. The sensor that Birgand was working with, s::can Measuring Systems’ spectro::lyser UV-Vis spectrometer, advertised that it could identify these constituents. But after looking at the data they generated, he saw an opportunity to do more.
“I was convinced from day one that the raw data in there was very, very rich and there was a lot of potential to extract a lot more than what people were advertising for,” he says.
Birgand contacted the manufacturer, but they were unable to share the proprietary algorithms the sensors use to identify the constituents of a sample. Through reading and talking to statisticians, his team eventually hit upon using a statistical technique called partial least squares regression, or PLSR, to identify what is contained in a water sample.
“The PLSR model statistically determines the change in constituent concentrations — say total phosphorus for example — by looking at changes in the measured absorption spectrum,” says paper co-author, Randall Etheridge. This means that once the machine is calibrated to local conditions, it can infer the amounts of certain compounds that can’t be directly measured.
To test the technique, the team used automated samplers to take physical water samples at the same time and in the same place that the spectrometer made its readings. Samples were collected and analyzed in the lab and then compared with the sensor data.
Laboratory analyses confirmed that the technique not only identified nitrate, dissolved organic carbon and total suspended solids — constituents often used when assessing water quality — but also other important parameters including total Kjeldahl nitrogen, orthophosphate, total phosphorus and salinity.
The predicted parameter with the most uncertainty, namely orthophosphate, or the type of phosphate immediately available for uptake by algae, can have a potential deviation of about 10 micrograms per liter. According to Birgand, this degree of uncertainty is small enough to allow researchers to get a fairly accurate idea of what is happening chemically in the aquatic environment.
“Uncertainties on our values are comparable to those we would get in the lab,” Birgand says.
Current sampling practices can tell a radically different story from what Birgand and his team are showing. In a presentation at the WRRI annual conference in March, Birgand displayed a graph of nitrogen levels in the marsh water derived from automated UV-Vis spectroscopy sampling at 15-minute intervals. To compare it with current water-quality sampling methods, he pulled out a 10-day portion of the data and overlaid on it the points taken by a six-hour sampling cycle.
“We would have possibly under or overestimated by 70 or 130 percent the nitrate retention over that 10-day period,” he said. “That’s just over 10 days. Imagine for a year.”

Fertilizer-rich water flowing into the marsh from agricultural lands contains nitrate, a form of nitrogen that can fuel algal blooms. To quantify how much nitrate nitrogen the marsh might retain, the researchers attempted a mass-balance, a measurement that compares how much of a substance goes into a system with how much exits. For more than 20 months, they took 15-minute measurements of flow and nutrient concentrations at two stations 2,100 feet apart in the marsh.
“We found that we got about 10 percent removal for marsh area,” Birgand says, referring to the nitrate retained by the marsh. This is somewhere between the removal rate of streams and wetlands. This makes sense, he says, as marshes sometimes behave like streams and sometimes like flooded wetlands.
The 10 percent absorbed by 2,100 feet of stream would be combined with absorption by the marsh areas further downstream, potentially removing up to 30 percent of the nitrate generated from the upstream farmland.
Moving Forward
Fouling was a major problem the researchers encountered while using these sensors to monitor water quality in marshes. Algal growth and chemical deposition due to electrolysis — a reaction caused by placing a charged piece of metal in saltwater — often clouded the optics.
To prevent electrolysis and reduce fouling, Birgand and his team removed the sensor from the water and instead pumped water from the marsh to the sensor. They then cleaned it with tap water, thus lowering exposure time of the sensor to the brackish water.
Additionally, because the probes also are expensive, Birgand and his team developed a technique for pulling water through tubes from multiple locations in the stream, thus allowing one sensor to sample from up to 12 locations.
These sensors and their expanded use are revolutionizing water-quality testing, Birgand says. He would like to see more deployed in the field to revisit questions that have lacked sufficient data. Their expanded use, he says, will generate data that will require water-quality models to be revised. He also notes that nutrients are not the only thing that has absorbance spectra.
“There are so many other parameters out there that are of interest — all the heavy metals, all the pesticides, all the organic matter. The list,” he says, “is endless.”
This article was published in the Summer 2014 issue of Coastwatch.
For contact information and reprint requests, visit ncseagrant.ncsu.edu/coastwatch/contact/.
- Categories:


