Hook, Line & Science
Red Snapper Hideaways, Lunar Luck, and More
The Award-Winning Series with Research and News for Anglers
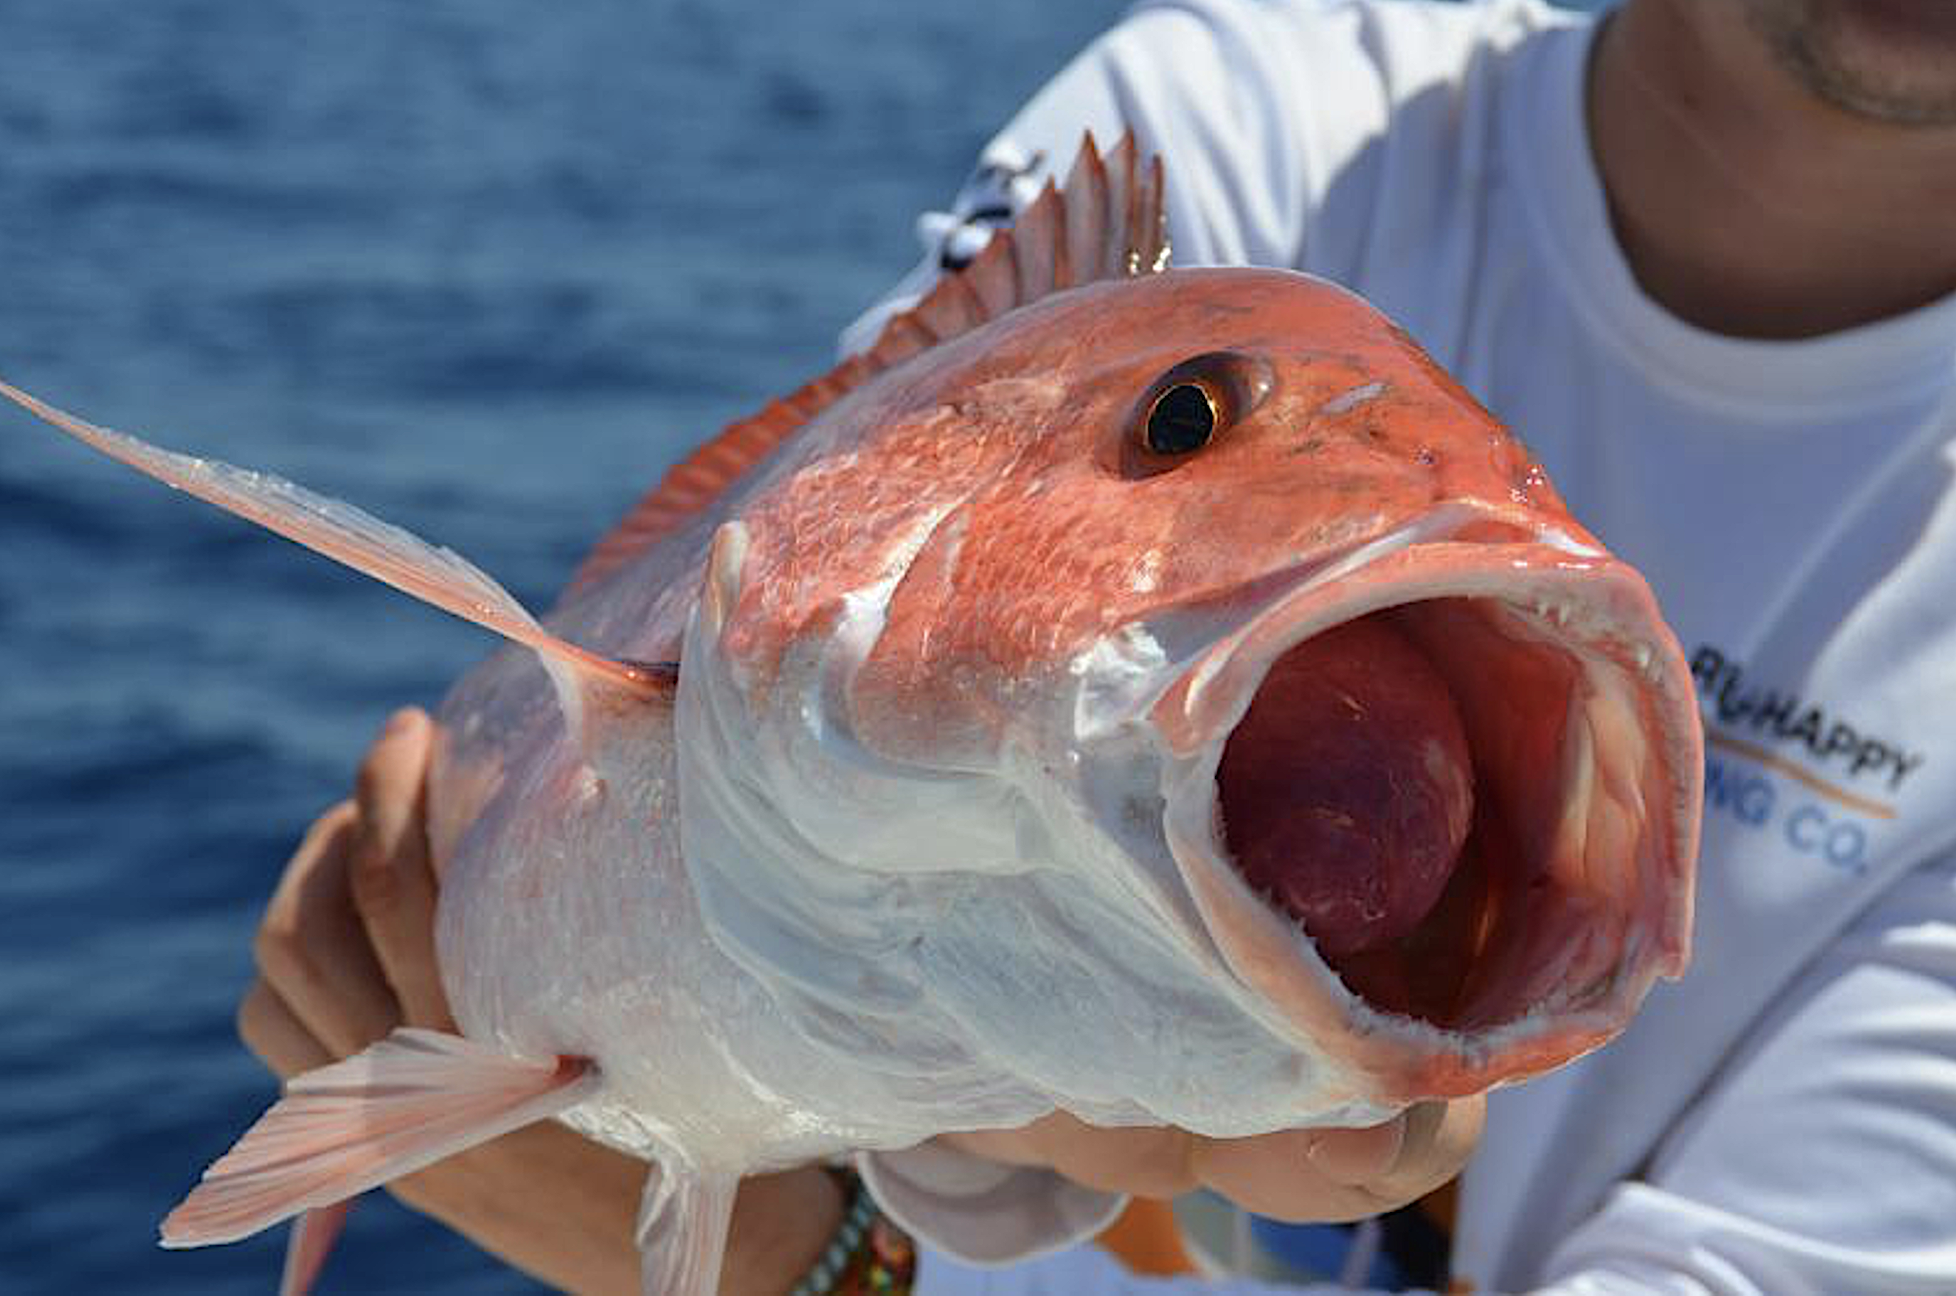
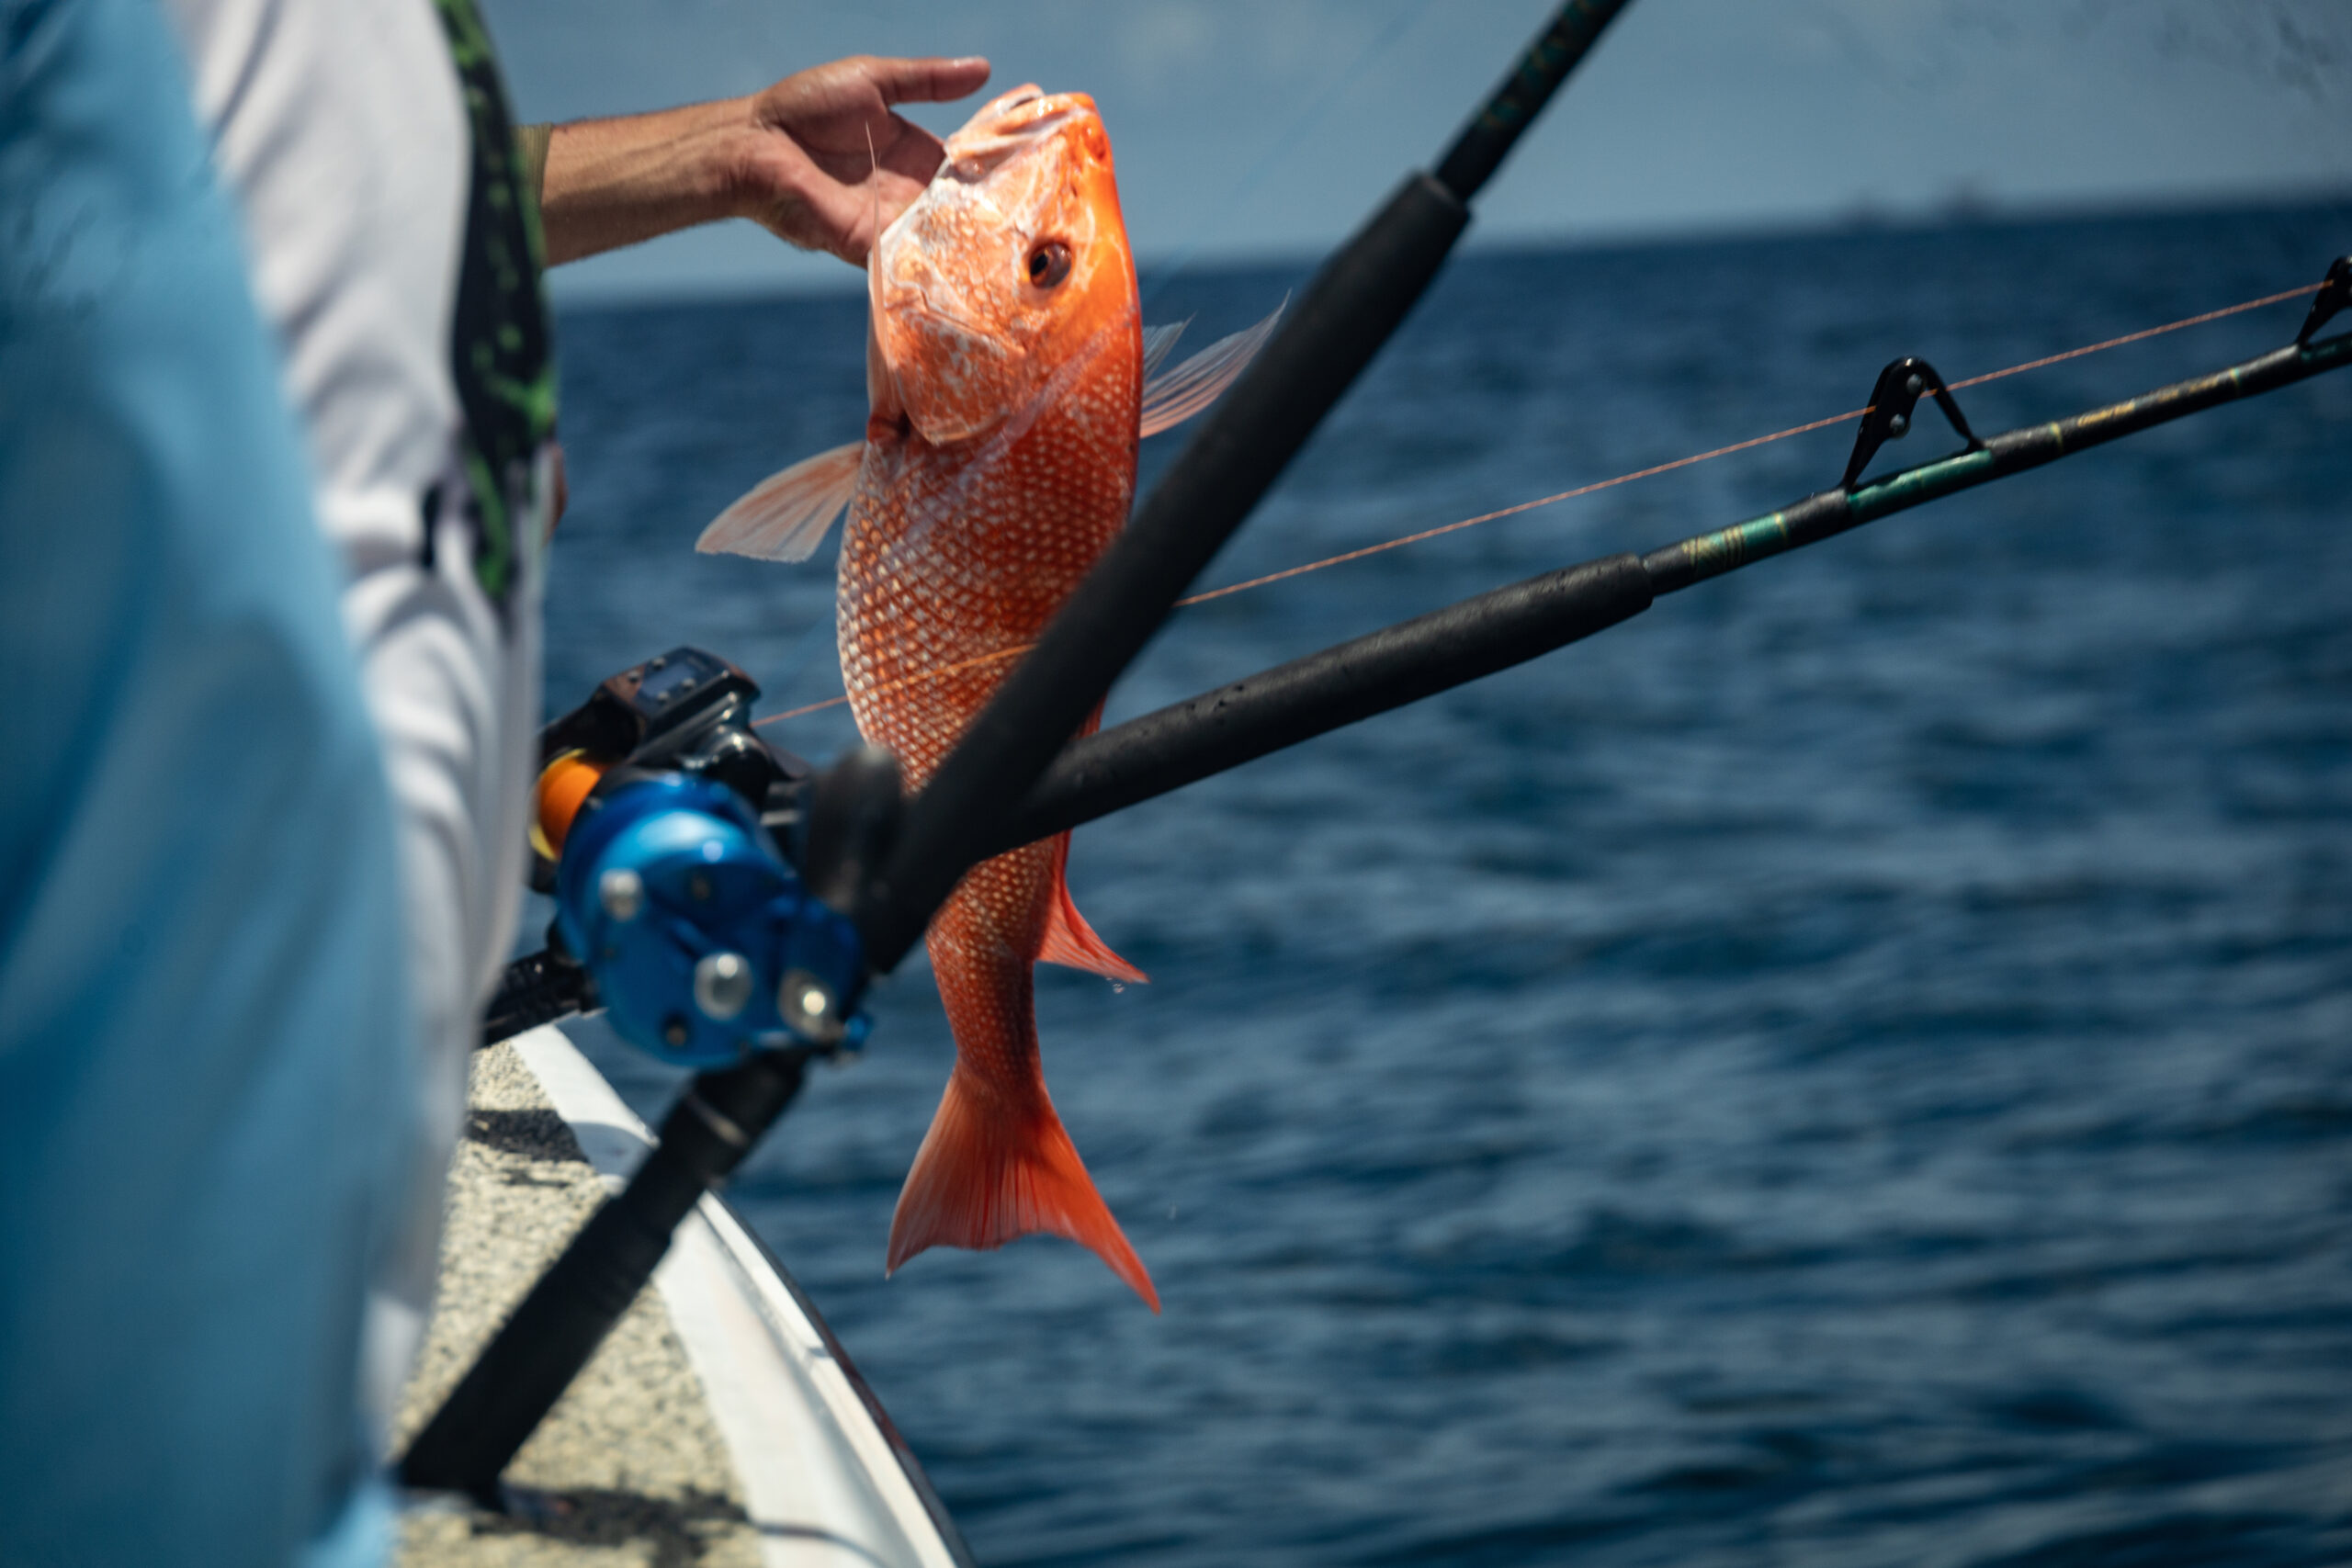
Where are Red Snapper Thriving?
New research sheds light on habitat preferences and regional trends.
A lot is happening in the South Atlantic red snapper fishery, despite the recreational fishery opening for only one day in 2024. The South Atlantic Red Snapper Research Program is filling critical knowledge gaps about red snapper with studies like the one below. Additionally, NOAA Fisheries issued a request for public comments on its plan to end and prevent overfishing of the South Atlantic red snapper stock.
Red snapper have long been an important part of both recreational and commercial fishing in the Southeast, with most catches coming from Florida, followed by South Carolina, North Carolina, and Georgia. However, overfishing led to the closure of the red snapper fishery in 2010, and management restrictions remain to this day.
Despite the red snapper’s popularity and economic value, little is known about its biology or habitat preferences. After the fishery closure, researchers wanted to learn more about these fish, especially whether a large group was possibly overlooked. However, these studies did not find any hidden groups of large or older red snapper living in deeper waters, where they might be harder to detect in regular surveys.
Several questions remain: How many red snapper are there? Where are they found? And which types of habitat do they prefer?
What did they study?
The Southeast Fisheries Science Center’s Nathan M. Bacheler and his colleagues used long-term traps and video surveys to track changes in red snapper numbers and where they lived from 2011 to 2022. Because the surveys only focused on structured reef habitats, the team also used remotely operated vehicles to sample unstructured sand-bottom habitats from 2021 to 2023.
The study area spanned the continental shelf and shelf-break from Cape Hatteras, North Carolina, to St. Lucie Inlet, Florida.
What did they find?
Between 2011 and 2022, the research team caught a total of 10,671 red snapper in 13,217 traps. The average number of red snapper caught in traps rose rapidly during this time, even after adjusting for factors like trap effort and environmental conditions. Standardized trap catches jumped from 0.37 to 3.90 fish per trap — an increase of about 1000%. Video surveys showed similar results, with red snapper counts rising from 4.2 to 52.4 fish per frame — roughly a 1100% increase.
The team found red snapper most commonly in the mid-shelf waters off the east coast of Florida and Georgia, with fewer spotted near the Outer Banks of North Carolina. The fish were less frequent off the coasts of southern North Carolina and South Carolina.
What else did they find?
Out of 282 video samples of sand-bottom habitats from Cape Hatteras to the Florida Keys, red snapper appeared in only seven. The highest number of red snapper were found at sites with a moderate amount of structured habitat. In stark contrast, no red snapper were found at any of the 197 sites with unstructured habitats.
These results support earlier research, which also found no evidence of large, unobserved groups of red snapper in unstructured habitats.
So what?
This study offers valuable insights into where and when red snapper are located in the Southeast, as well as the types of habitats the species prefers.
The significant increase in red snapper numbers since the 2010 fishing closure highlights the effectiveness of management actions. The data on red snapper’s regional and habitat preferences may be useful for creating marine protected areas, refining management strategies, and improving estimates of total red snapper numbers in the Southeast region.
By Madeline Payne, communication fellow for Hook, Line & Science
the full study
“Spatiotemporal dynamics and habitat use of red snapper (Lutjanus campechanus) on the southeastern United States Atlantic continental shelf” in Fisheries Research

How Does the Moon Phase Affect Fish?
A new study suggests when anglers might have the most lunar luck.
Various fish species have always experienced the lunar cycle’s effect. Scientists have conducted multiple studies on fish migration, spawning, and feeding behaviors in relation to the cycle. These studies show highly complex patterns across a wide diversity of species.
A new review of previous research focuses on identifying common patterns of lunar effects on large, surface-level species — specifically tuna, billfish, sharks, and rays.
What did they study?
A team of Stanford University scientists searched several sizable databases for previous research and then recorded key pieces of information, including species, lunar measurements, and study location. Each study was carefully evaluated by a minimum of two team members. Altogether, the team reviewed 190 studies.
The studies encompassed many disciplines and types of measurements. Shark studies often focused on movement, while tuna and billfish studies were primarily the subjects of fisheries science. Overall, most of the studies focused on billfish, with swordfish the most studied billfish species.
What did they find?
Many studies had used electronic tagging methods of various kinds. Slightly over half (51%) showed fish swimming into deeper waters as lunar illumination increased, and only 5% of the studies showed movement into shallower waters. This pattern was strongest in tuna species.
Although they displayed the same pattern overall, billfish and shark species showed more variability. For sharks, the results were more species-dependent, with four species moving into shallower waters as lunar illumination increased: the bull shark, Galapagos shark, oceanic whitetip shark, and the largetooth sawfish.
Shark, tuna, and ray species did not show a significant relationship between catch rate and the amount of lunar light. However, catch rate for swordfish increased as lunar illumination increased — although other billfish species didn’t show a similar trend.
Acoustic data revealed a few species-specific movement patterns based on moon phase, particularly in ray species. Spawning rates were also species-specific but with no noticeable patterns.
Many species showed activity changes throughout the lunar cycle. Most sharks showed increased activity during full moons, with some showing increased activity at new moons as well.
Predator-prey interactions, biological rhythms, tidal effects, and other factors may also influence these studies’ findings. In addition, a lack of consistency across data gathering methods and study goals would have impacted the results.
So what?
Understanding the effects of the lunar cycle on fish behavior can better inform fisheries managers. Synthesizing data like these scientists did from studies conducted on similar species under different circumstances can help identify commonalities, patterns, and correlations that increase understandings of this and other phenomena.
By Ruthie Froning, contributing editor for Coastwatch
the full study
“Lunar cycle effects on pelagic predators and fisheries: insights into tuna, billfish, sharks, and rays” in Reviews in Fish Biology and Fisheries
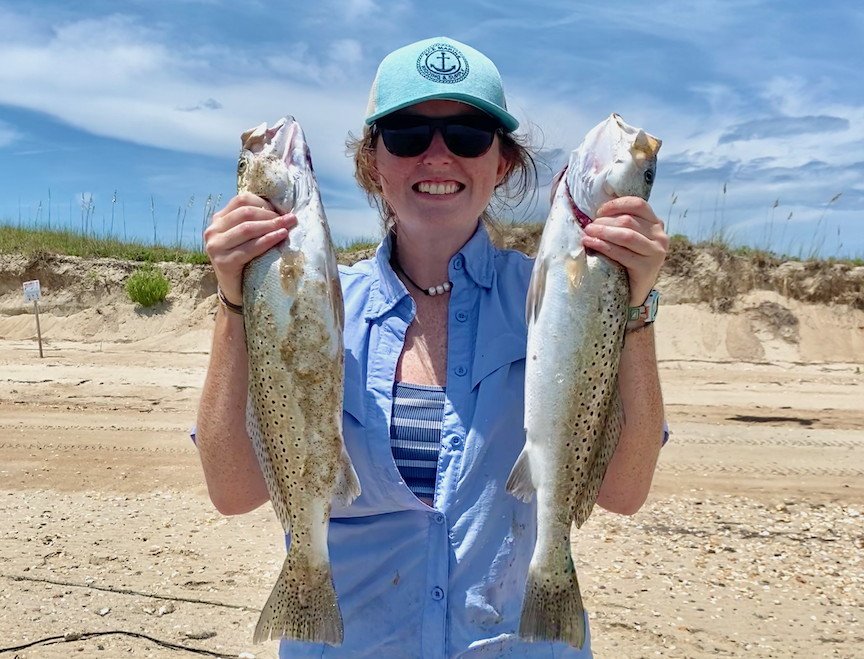
How Does Winter Weather Affect Spotted Seatrout?
Spotted seatrout are a popular fish for anglers, and winter “cold stun events” present challenges for the species.
In late January, triggered by a large coastal winter snowstorm, the N.C. Division of Marine Fisheries (NCDMF) closed harvest of spotted seatrout, both commercially and recreationally, to protect the population. Prolonged periods of cold air temperatures dropped water temperatures below a point that the fish can withstand.
Basic weather conditions, such as temperature and rainfall, influence fish biology and seasonal habitats. Strong winter storms are not the norm in North Carolina’s mild climate but can lead to “cold stun” fish mortality events.
Cold stun events occur when the water temperature falls outside of a fish species’ optimum range, causing lethargic and unresponsive behavior. When water temperatures drop to a point where fishes become stunned, it is often fatal.
Spotted seatrout, in particular, are susceptible to this, and North Carolina is their northern geographic range. However, in controlled temperature experiments, fish have recovered after being stunned if they are immediately placed in warmer water.
To improve management of the fishery, biologists need to better understand the seasonal variation in the numbers and locations of spotted seatrout within North Carolina waters, especially with regard to the severity and duration of cold stun events and how they affect survivability.
What did we study?
Spotted seatrout in the Pamlico Sound, and in the Neuse and Pamlico river systems, served as a model case study of cold stun events. We used NCDMF gillnet survey data to estimate the relative abundance of the stock.
We then developed a model that allowed us to relate changes in population to cold stun events.
What did we find?
Going into the study, we believed that the mortalities due to cold stun events during winter would likely result in a declining relative size of the population the following spring.
Studies have shown that spotted seatrout start to show cold stun symptoms when temperatures drop just below 45°F. Using historical North Carolina water temperature data, we found a statistical relationship between seasonal changes in the size of the population and the total number of days where the water temperature was below 45°F.
Specifically, our model showed that for each additional day the average water temperature stayed below the 45°F threshold, the difference in the size of the population after winter decreased by almost 5.5%.
What else did we find?
Additionally, we found that not all reported cold stun events affected the population equally. We were able to determine the potential location and scale of each cold stun event. We calculated the percentage of the total study area that experienced the most significant declines in spotted seatrout after a cold stun.
Our analysis revealed that some cold stun events seemed to have localized effects, impacting specific regions scattered throughout our study area, while others were more widespread and impacted the entire study area more uniformly. In years with greater population declines and more days when the water temperature was below 45°F, cold stun events significantly affected a larger area.
So what?
Knowing the severity of past cold stun events provides insight on how to predict their impact on the spotted seatrout population in the future.
NCDMF’s current guidelines to determine whether a cold stun event warrants a fishery closure are based on water temperature triggers or the incidence of cold stunned fish in at least four counties. As a result, NCDMF classified the cold stuns in January 2011 and 2018, for instance, as severe enough to close the fishery. However, our model showed that 2011’s cold stun impacted a significantly larger area than 2018’s.
The methods developed in this study connect water temperatures to predicted losses following a cold stun event, which can inform new management measures and guidelines.
To report a cold stun event, please call Marine Patrol at 800-682-2632 or contact NCDMF spotted seatrout biologist Lucas Pensinger at 252-515-5638 or Lucas.Pensinger@ncdenr.gov.
By Johnna Brooks, former joint fellow with NOAA’s National Marine Fisheries Service and Sea Grant
the full study
“Quantifying intra-annual changes in abundance and distribution to identify the magnitude and scale of potential mortality events” in Estuarine, Coastal and Shelf Science
Read more at HookLineScience.com
lead photo: kyle/AdobeStock