Vital Signs: The Hottest Ocean in Recorded History
NOAAand NASA track dramatic global changes.
Covering more than 70% of the earth, our global ocean has a very high heat capacity, and the top few meters of the ocean store as much heat as earth’s entire atmosphere.
Ninety percent of global warming is occurring in the ocean, causing the water’s internal heat to increase since modern recordkeeping began in 1955.
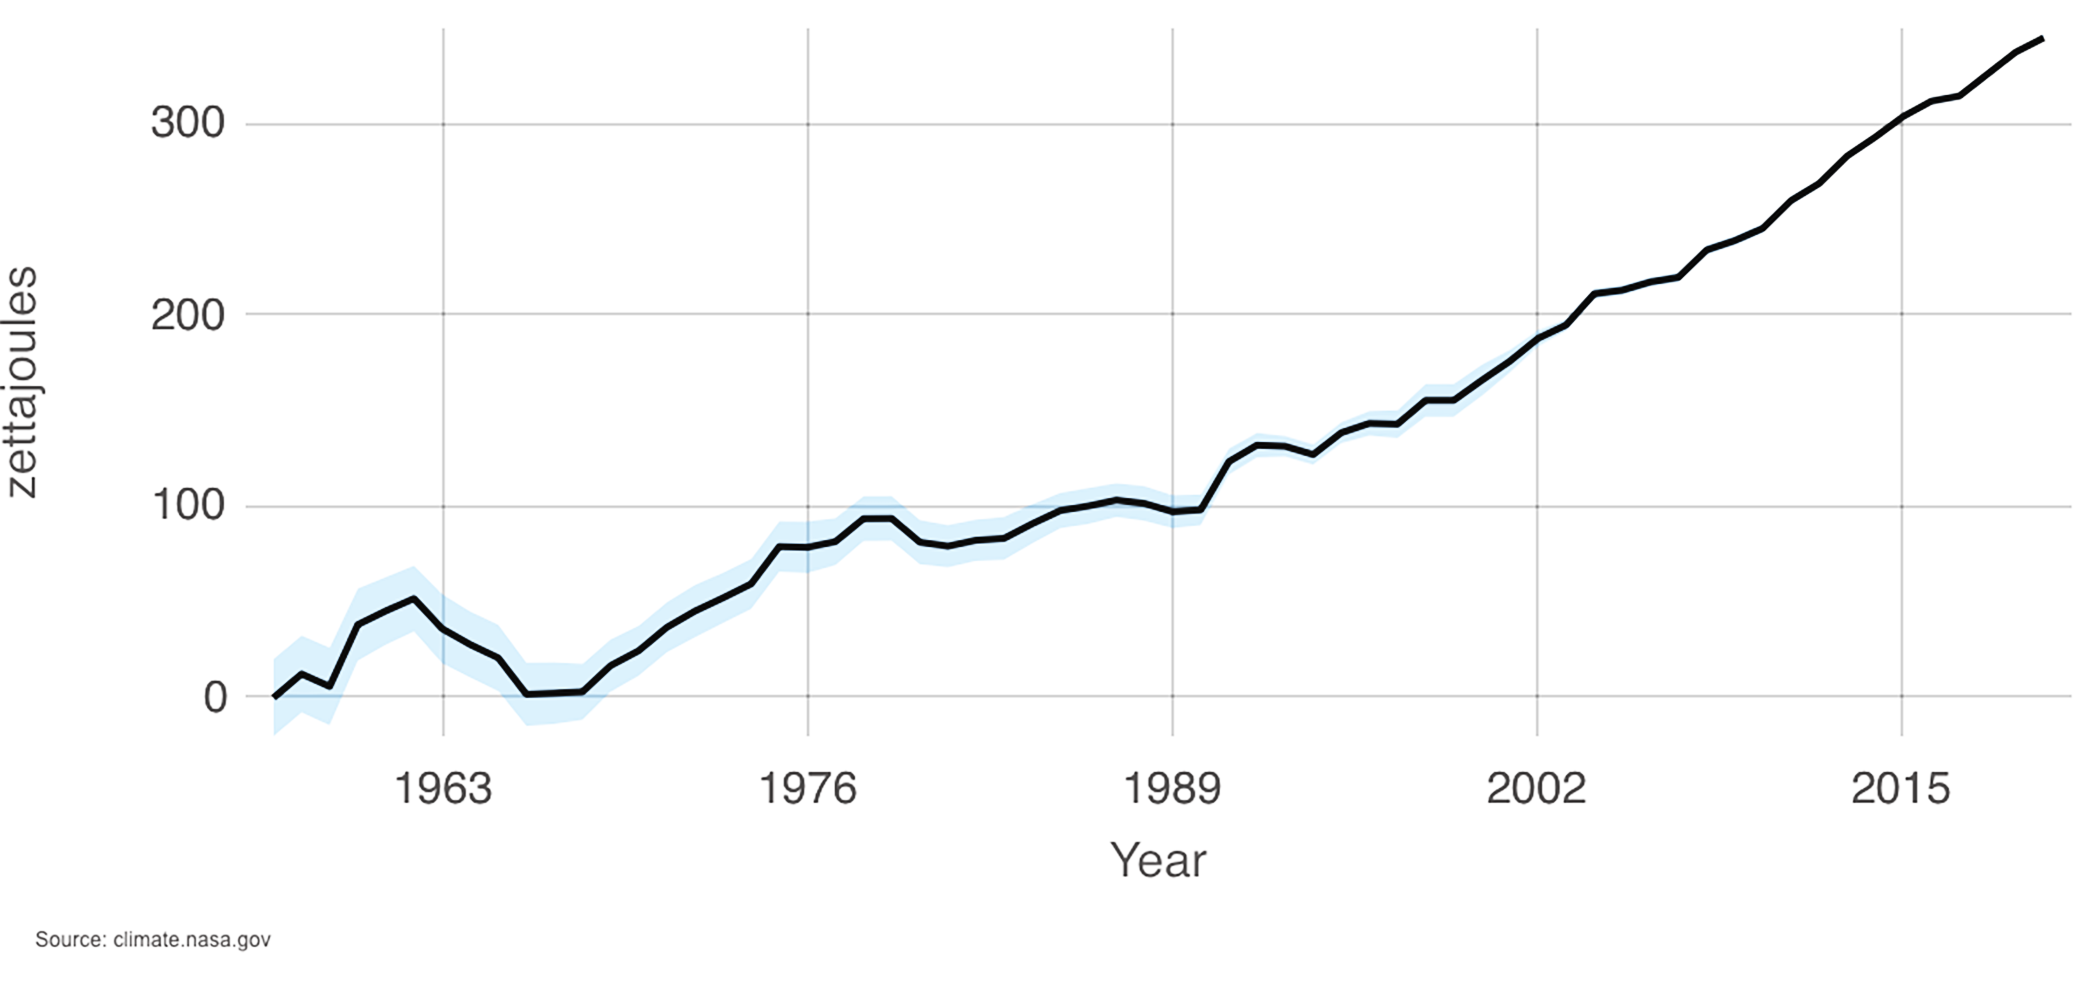
The chart above shows annual estimates for the first 2,000 meters of ocean depth. Each data point represents a five-year average. For example, the 2020 value represents the average change in ocean heat content (since 1955) for the years 2018 through 2022.
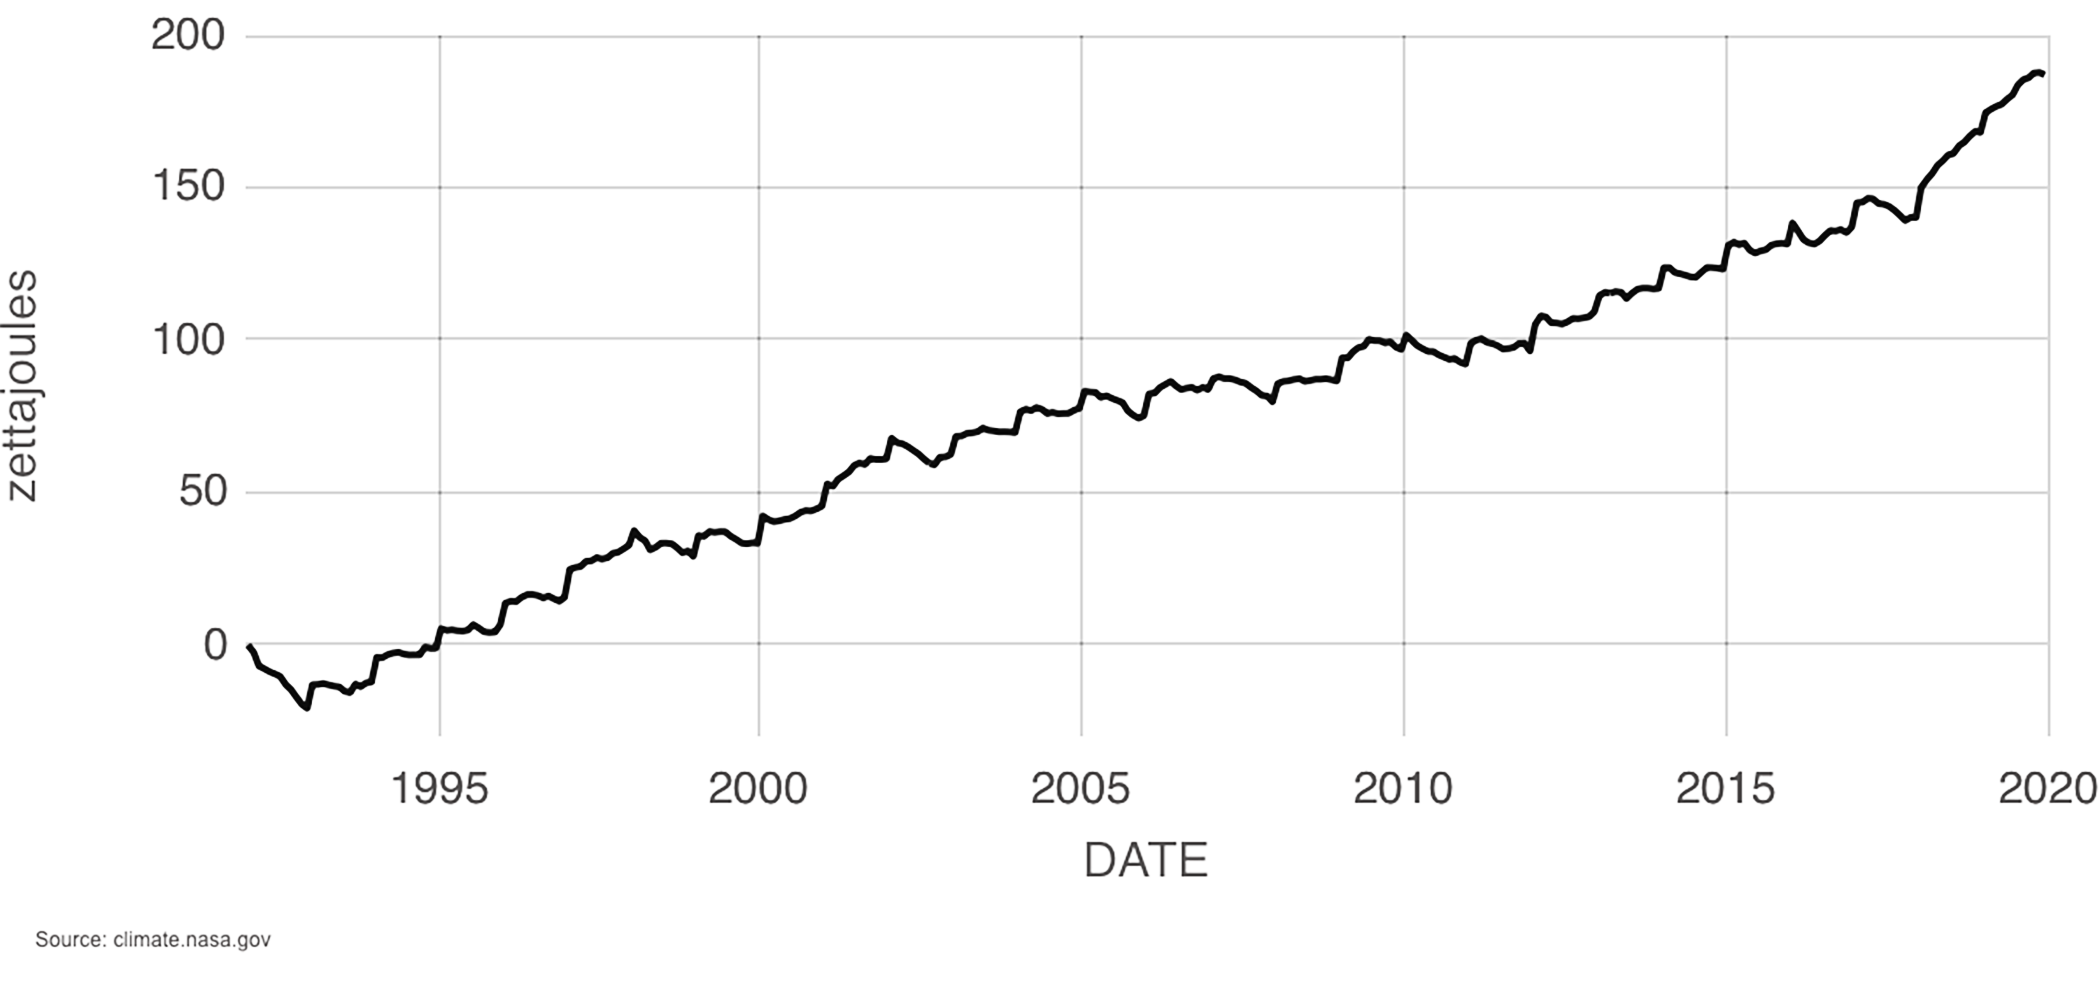
The chart below tracks monthly changes in ocean heat content for the entire water column (top to bottom of the ocean) from 1992 to 2019, integrating observations from satellites, in-water instruments, and computer models.
Both charts are expressed in zettajoules.
Heat stored in the ocean causes its water to expand, which is responsible for one-third to one-half of global sea level rise. Most of the added energy is stored at the surface, at a depth of up to 700 meters.
In addition to causing sea level rise due to thermal expansion, the effects of ocean warming include accelerated melting of Earth’s major ice sheets, intensified hurricanes, coral bleaching, and changes in ocean health and biochemistry.
The last 10 years were the ocean’s warmest decade since at least the 1800s. Last year was the ocean’s warmest recorded year and saw the highest global sea level.
adapted from NASA’s Vital Signs of the Planet
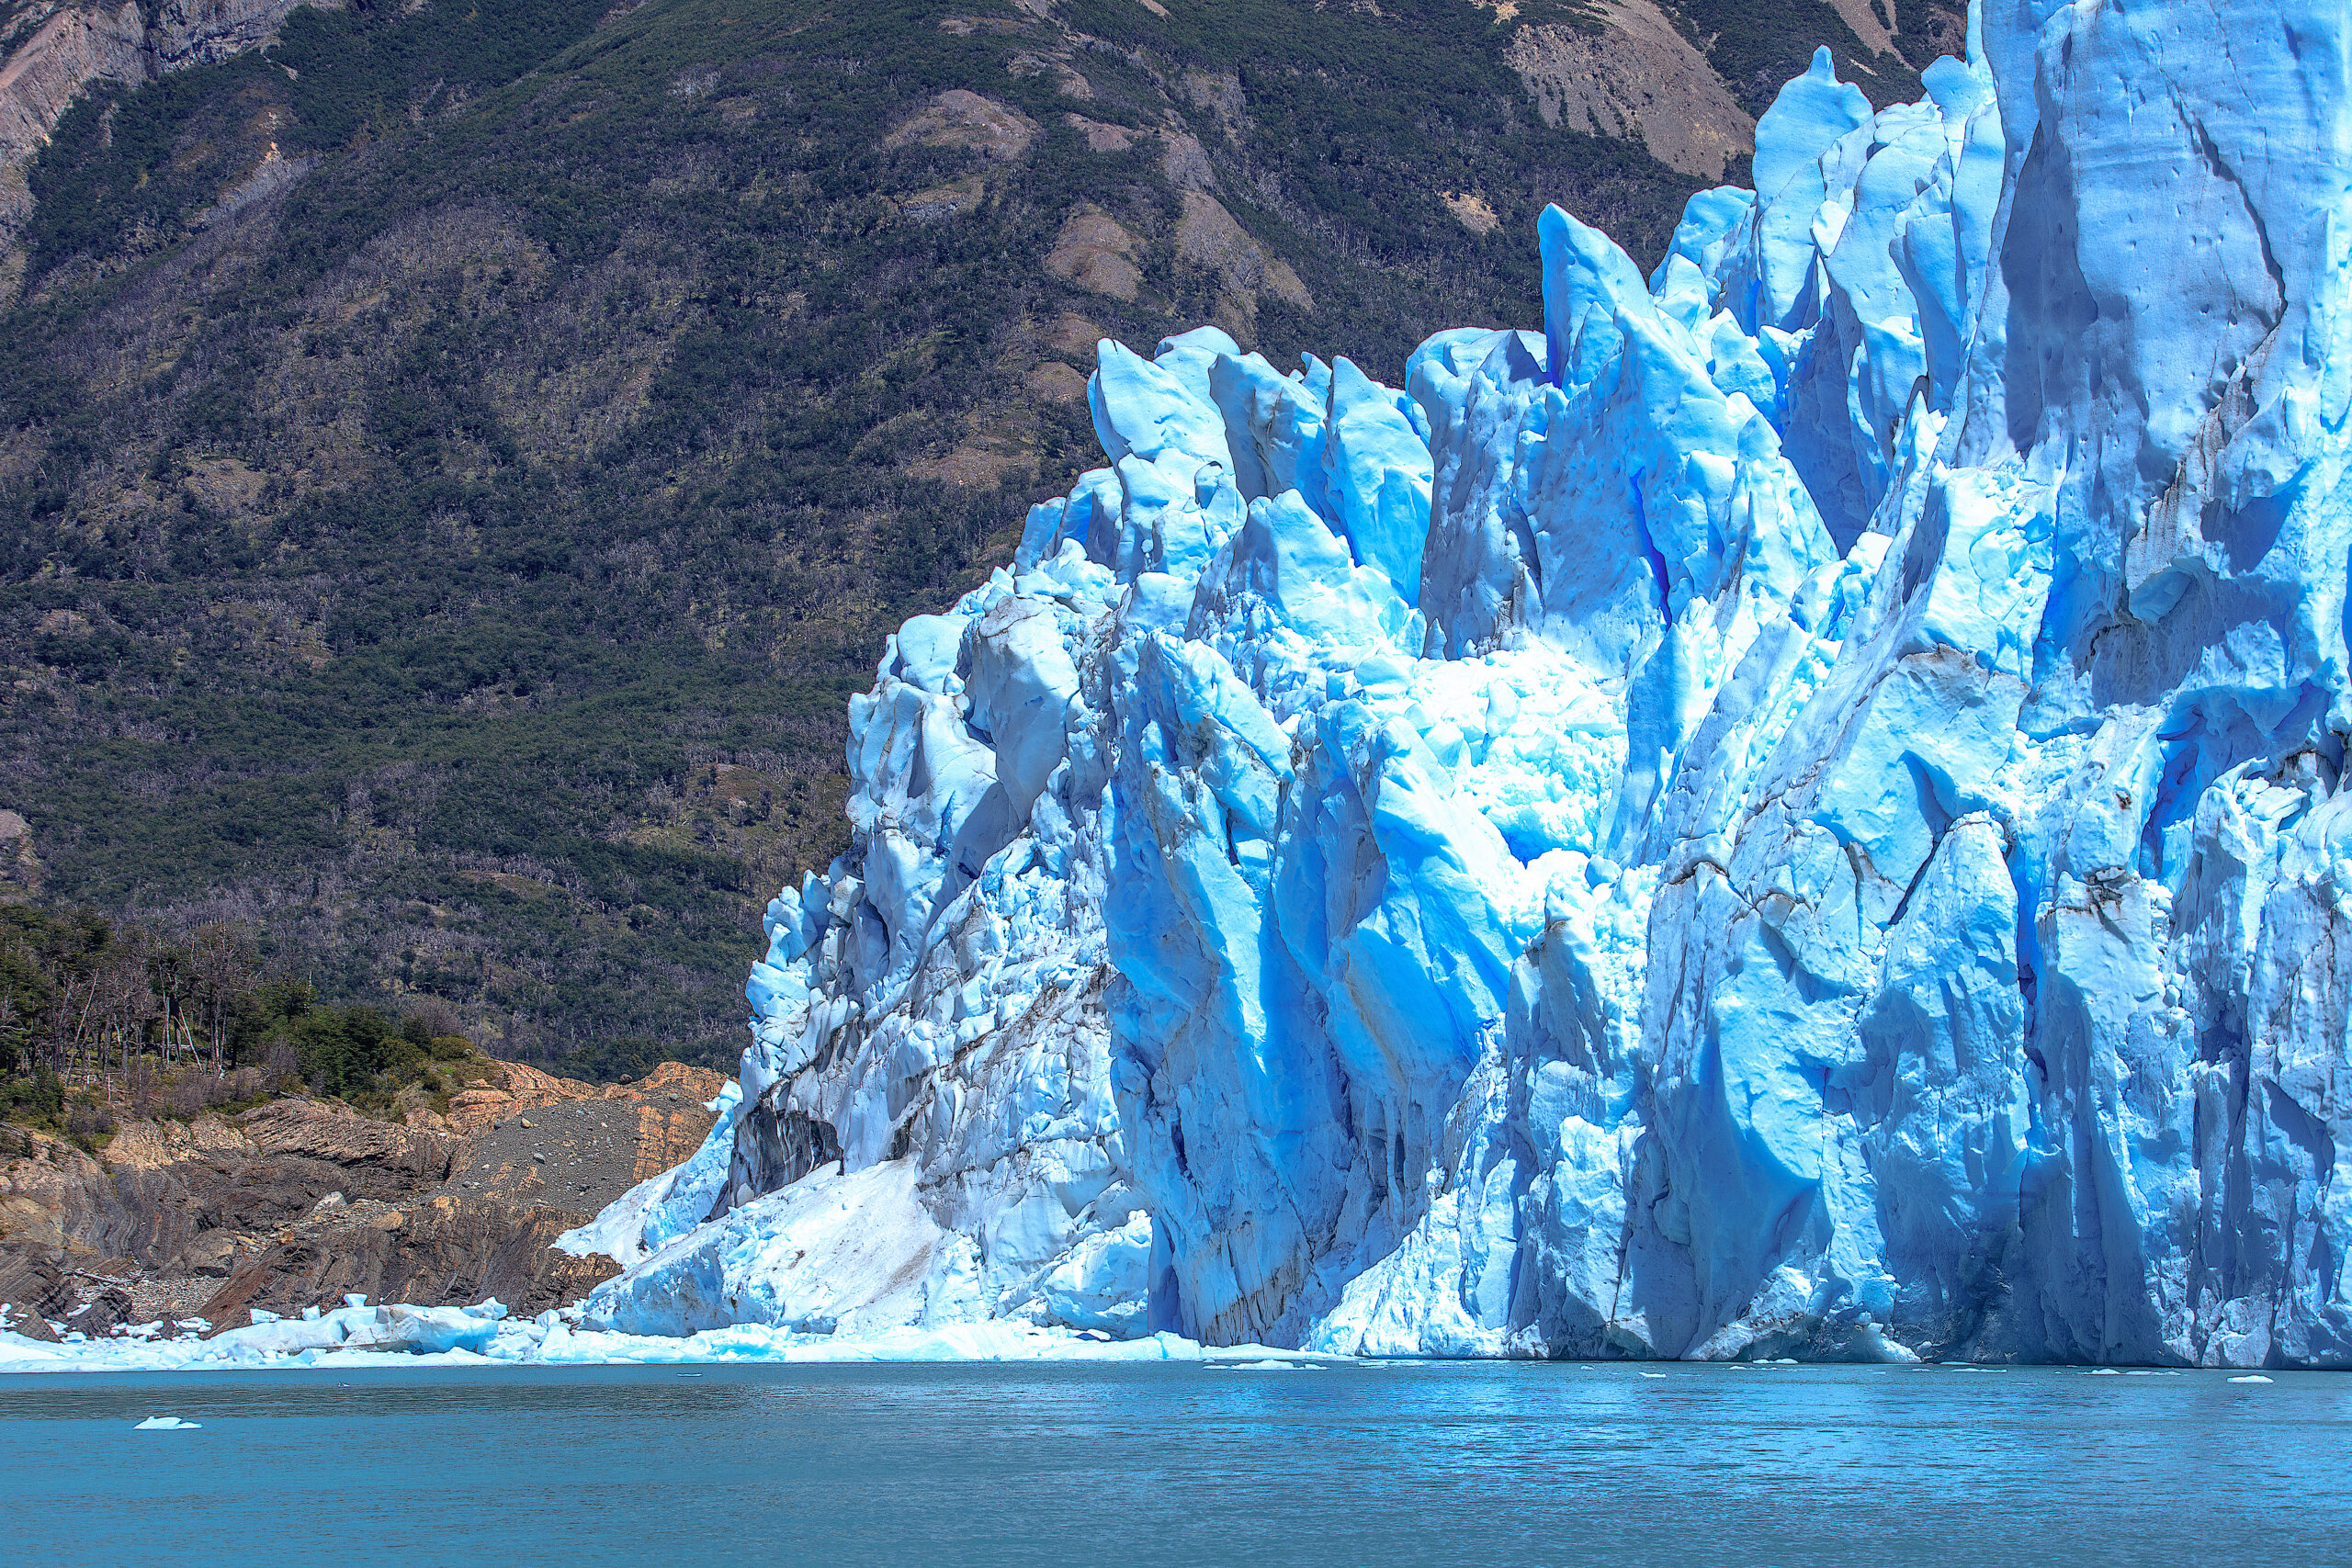
lead photo: Observations from satellites and numerous ocean measurement devices tell the same story of warming seas over the last few decades. The effects include the accelerated melting of Earth’s major ice sheets. Credit: Murray Foubister/CC BY-SA 2.0.
- Categories: