Last Word: Coastal Change in North Carolina
“I’ve always been passionate about conveying good science and consistent science to the people who can put it into use.”
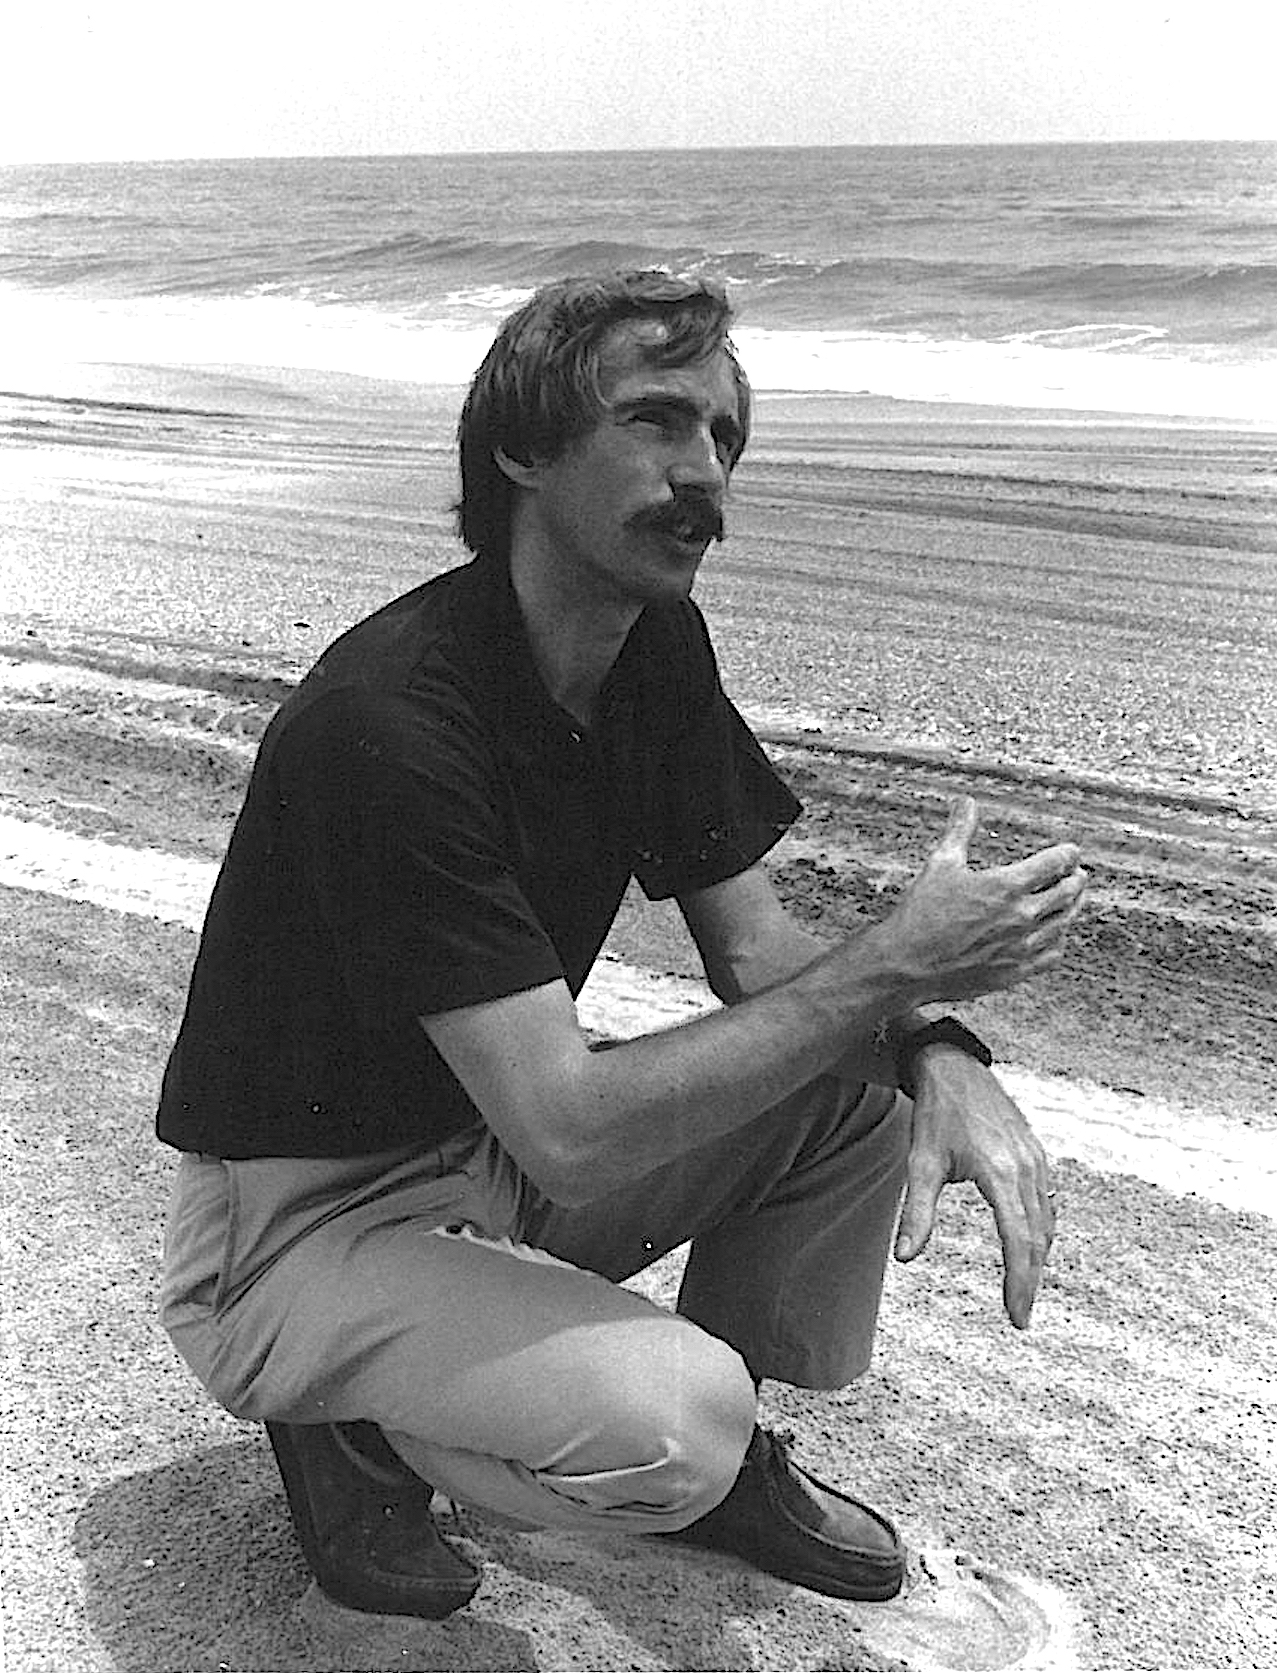
— Spencer Rogers
In 1978, when Spencer Rogers became one of North Carolina Sea Grant’s early extension specialists, the first regulations for the N.C. Coastal Area Management Act were starting to take effect. For more than four decades, he would use his coastal engineering and geology training, as well as his experience, to address hurricane-resistant building construction, shoreline erosion, green construction, coastal management, and more. The state’s Order of the Long Leaf Pine and the national Sea Grant network, among others, have honored his work. Before he retired in February, he spoke with Katie Mosher, North Carolina Sea Grant’s communications director, about coastal hazards and resilience — and what he anticipates for the future.
Katie Mosher: You have served on the state’s Science Panel on Coastal Hazards, and sea level rise has been an issue in recent decades. What has been the longer-term purpose of the panel’s work?
Spencer Rogers: One of the science panel’s most important efforts has been the sea level rise study in 2010. I was one of many who worked on that study — a particularly challenging topic because of the uncertainty of what impact climate change and sea level rise will have at different scales. Not only are there future climate issues, there also has been a historical increase over our own lifetimes.
The sea level rise report made clear that historically it has been increasing. The group of experts assembled by the panel agreed that an acceleration in the future is certain to occur. That acceleration has been slower to see in North Carolina then has been recorded in other parts of the United States or elsewhere.
The response at the time by the N.C. General Assembly was to ban the report from being implemented. But the report predictions were never intended to be implemented as a regulatory tool. It was always a planning document. So, the prohibition that was established really didn’t prohibit anything that was actually going to be done.
Ironically, while the report was referenced by the Colbert Report on national television, North Carolina did not get credit from Colbert or others that we were one of the first states to actually require sea level to be studied.
The panel provided an update in 2015. That report process was a critical turning point in our understanding that sea level was not a constant. It never has been and never will be. We’re actually at the point where the methods that we used in the last report — to observe sea level rise changes and to project them into the future — are relatively routine. Now, in an extreme event, they can monitor in real time or near real time and report what water levels are doing in most of the coastal rivers and streams and major bays. That level of ongoing data was encouraged by, and I think the result of, our sea level report.
Note: In February, the N.C. Coastal Resources Commission determined it will ask the Science Panel for shorter annual updates on sea level rise to identify new research or forecasts. The panel may also prioritize related items or topics for additional study.
Are there related issues that North Carolina officials and residents need to consider?
The land is changing as well as the sea level is changing at the same time. So, the question for the science panel becomes: Can stations in the NC Flood Inundation Mapping and Alert Network, known as FIMAN, be used to identify sea level rise? I suspect the answer to that probably is: Not yet; but maybe in the future, particularly if the data review and archiving is improved.
There’s a second key question: Can the state provide better measures of land subsidence? The first sea level rise study said that parts of North Carolina are subsiding. The second study in 2015 said that you can divide that into four segments. The northeast quadrant is what’s subsiding the most in North Carolina. So that makes local sea level rise the fastest in those parts of the state.
Another resource that we identified to help determine changes to landforms is the N.C. Continuously Operating Reference Station, a network of the Global Navigation Satellite System. They’re used by private surveyors, but they take position measurement in multiple ways every second or two — and have been doing that for years. So, they’re essentially measuring local ground elevation changes compared to GPS satellites.
Can we use those stations to measure landform changes near the towers — and if so, how far from the towers? Can those numbers actually be applied to represent landform changes in coastal North Carolina? I think that the answers are still undefined. The science panel could probably put their resources to good use to determine if that data provides good measurements for landform changes, as a tool to improve our ability to measure local sea level.
Many coastal communities also experience flooding that is not associated with a particular storm. Can you explain?
When you get in the estuaries, those sunny day flooding events can become a significant nuisance — and will continue to get worse in the future as sea level rises. The science panel may look at best ways to describe to local officials and residents how they can use tidal data to determine the increasing frequency of these types of nuisance flooding.
If you plan mitigation — such as to raise a road or raise a house X number of feet — then you can predict how long that mitigation action will be effective. That’s very important information for decision-makers at personal and community levels, and state levels. A case study could use gauges at the USS North Carolina battleship next to the Wilmington tide gauge. Another location could be Pivers Island in Carteret County, where two of the primary NOAA gauges are installed. We know the data exists at those sites. The question becomes: Can we use data so that nuisance flooding can be better predicted?
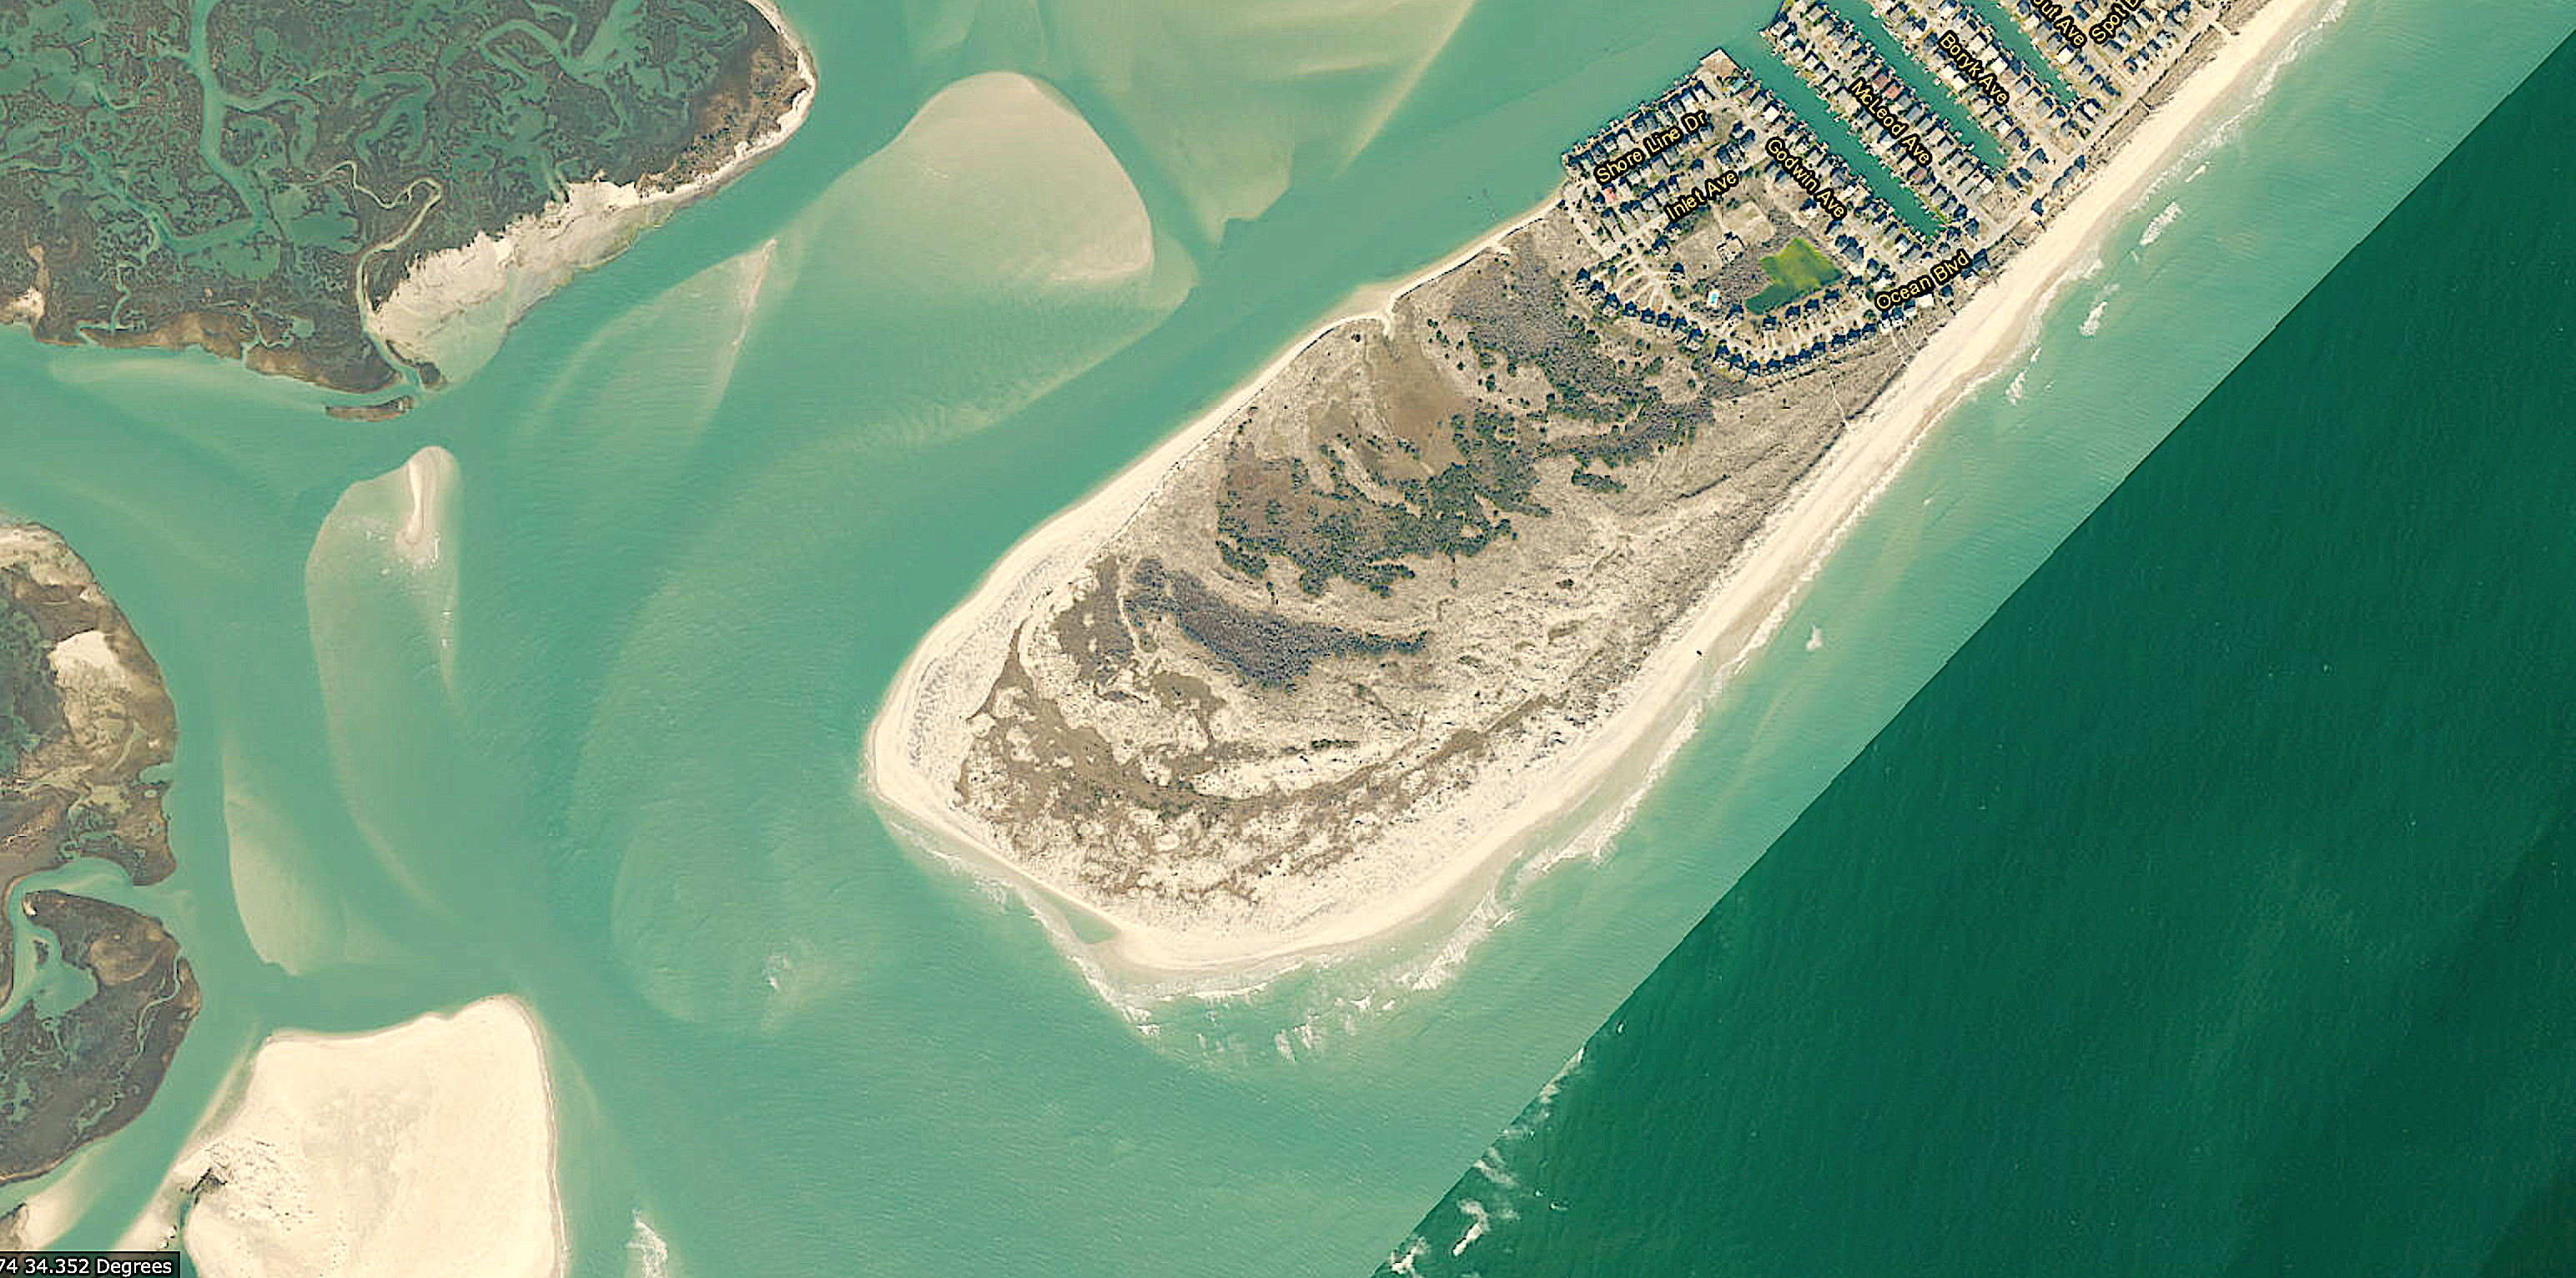
Katie: You have noted that “Inlet Hazard Areas” are another success story for the panel, one that is still in process. What are they are and why do they matter?
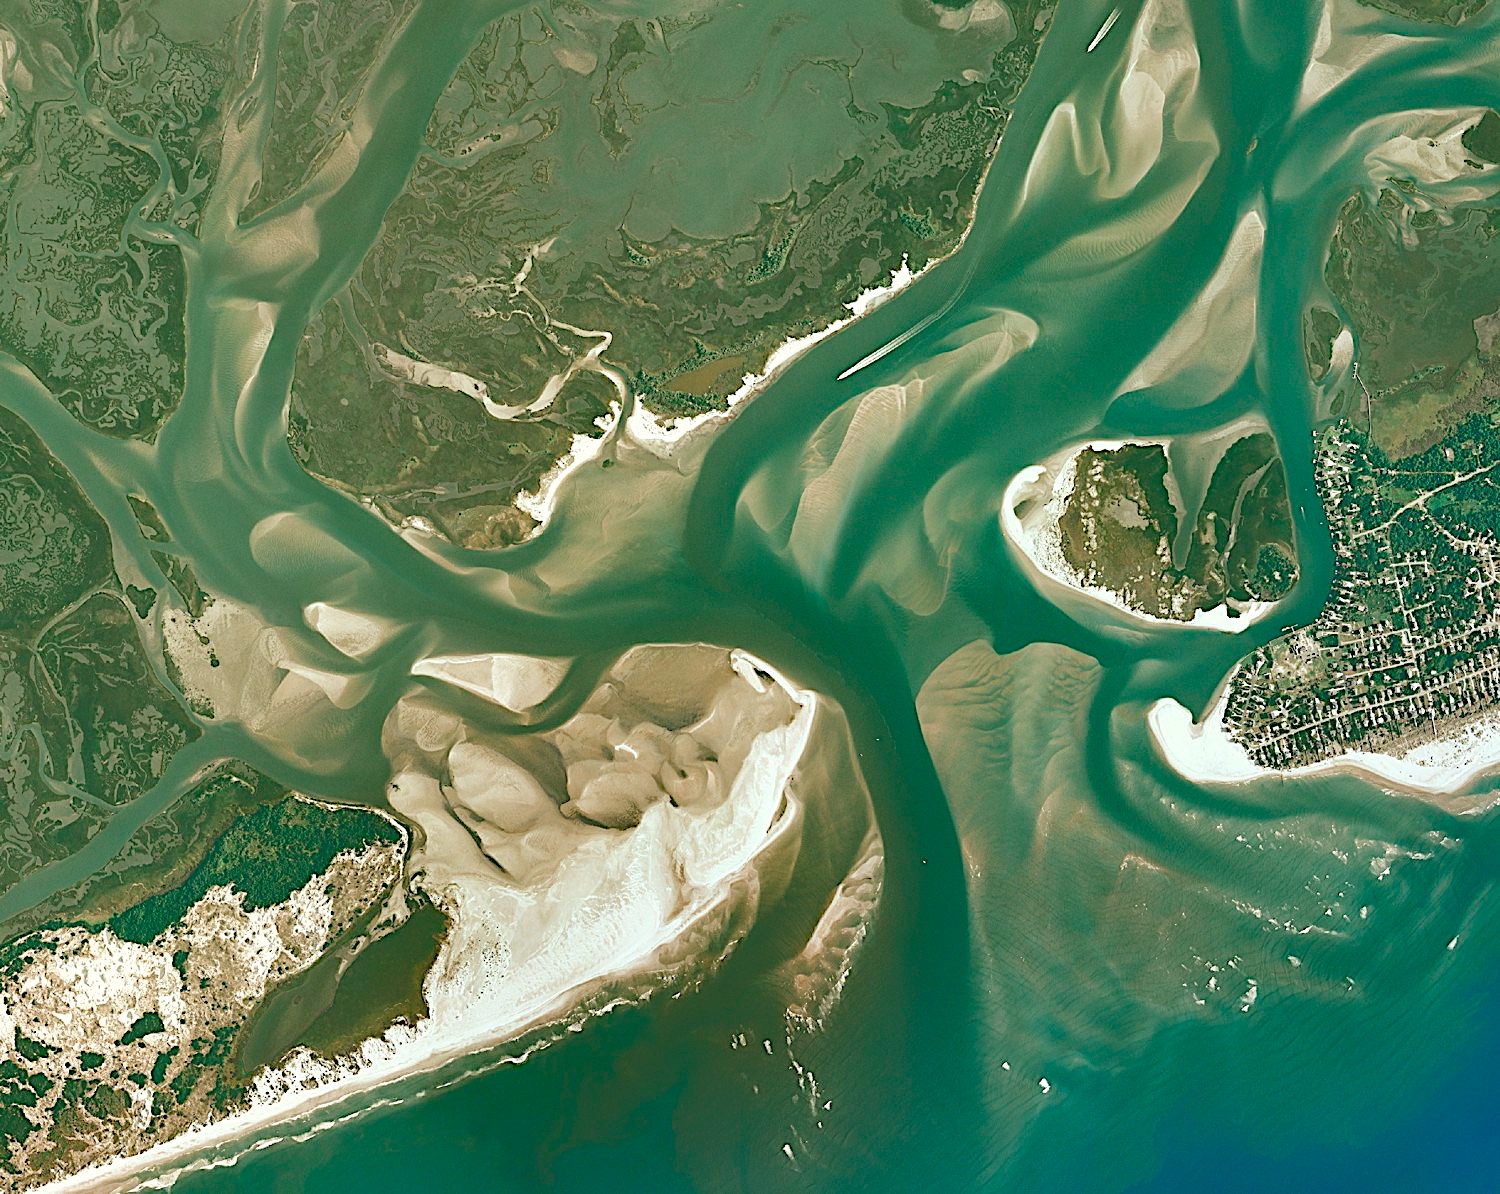
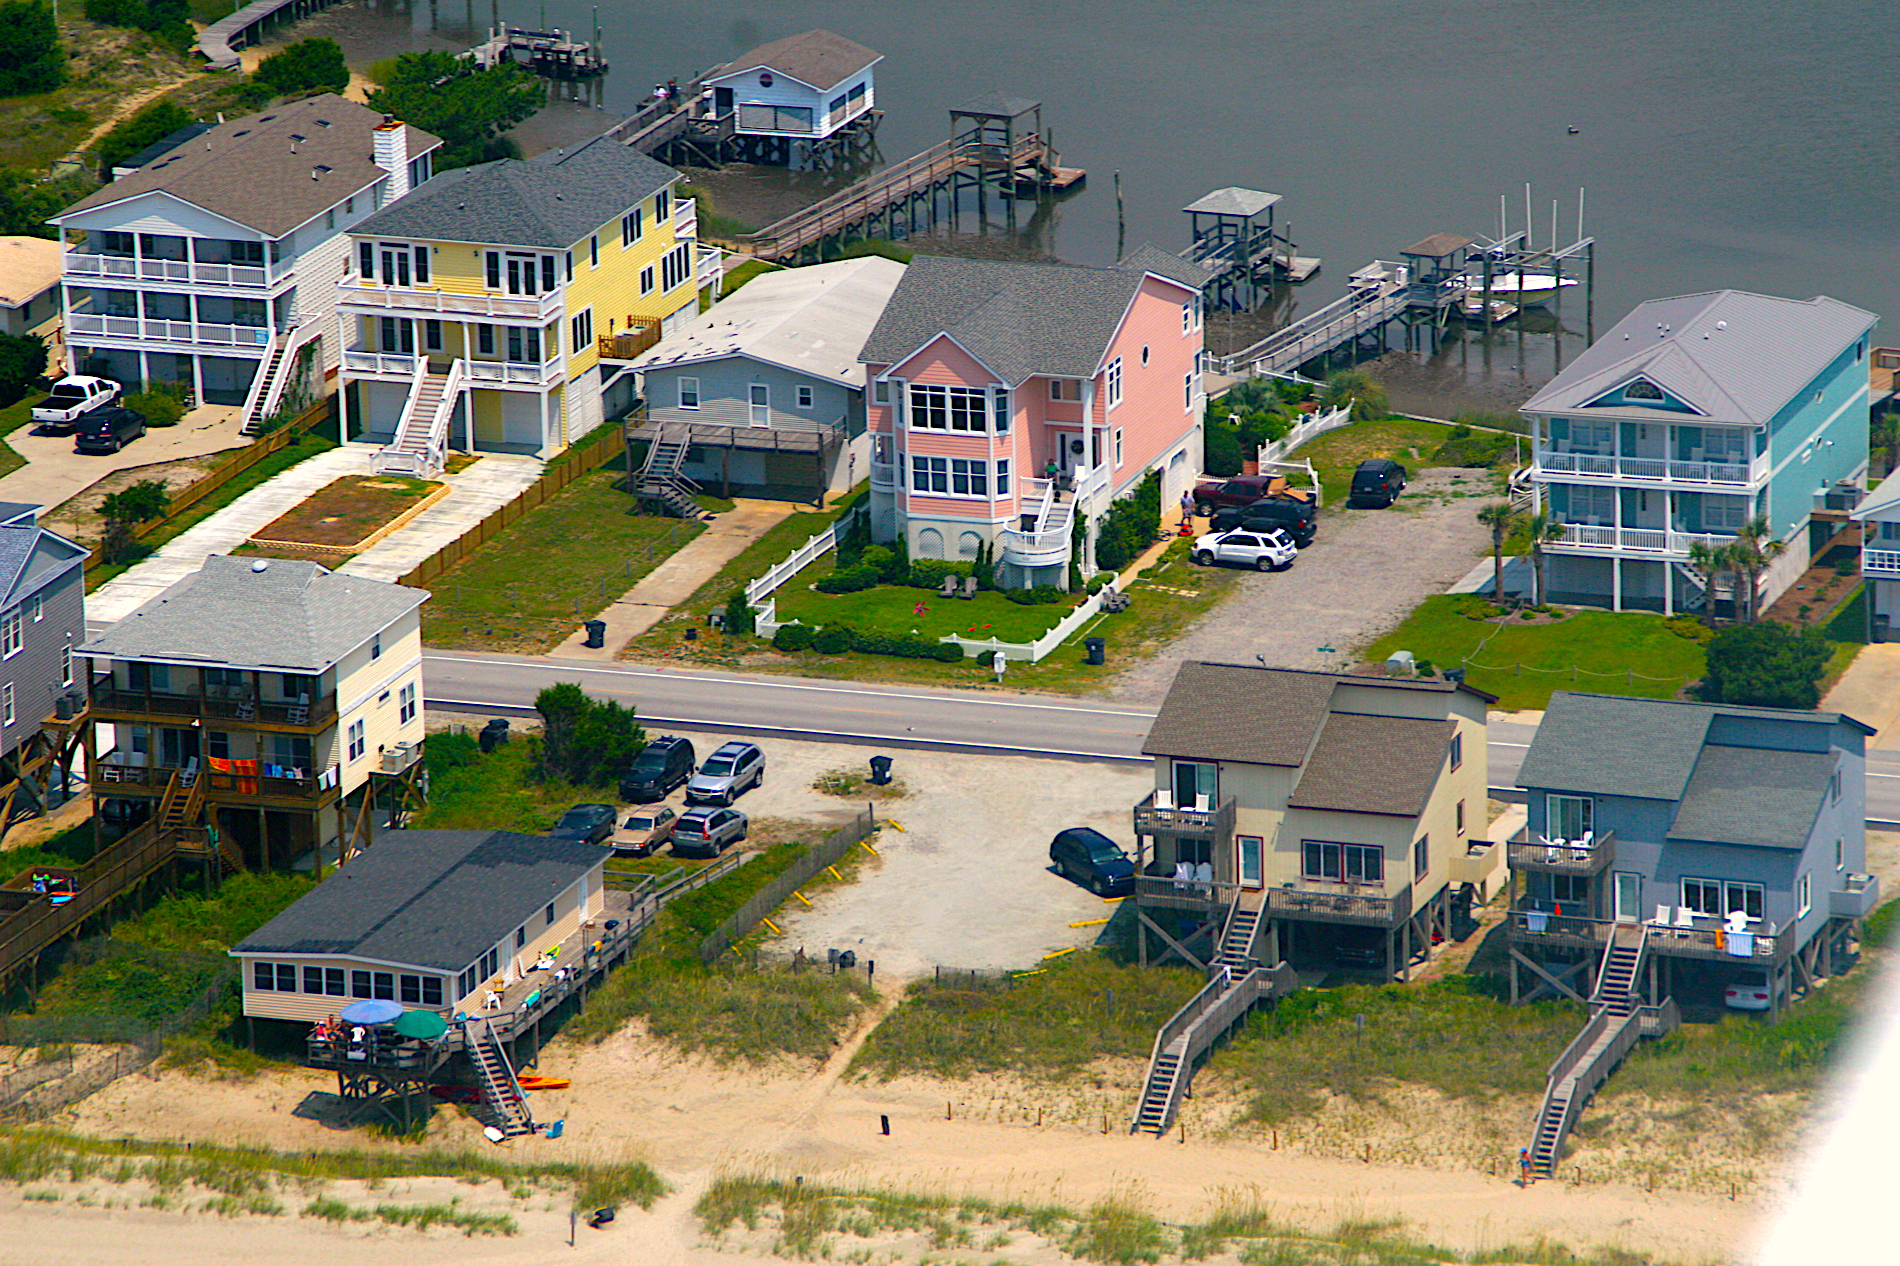
By far the inlets are the most volatile shorelines in the state, both eroding and accreting. Inlets have some of the longer-term trends. Some inlets oscillate or have cycles. Some oscillations are on the order of three to five years. But others are oscillating over 40 or 50 years. One side of the inlet gains as the other side loses, but eventually the cycle reverses.
In 1978, one of the original inlet studies that was done in North Carolina looked at changes in the inlet shoreline between islands. Our new report looks more closely at inlet influence along the oceanfront of the barrier islands. Those hazard areas can extend for a mile or more beyond the inlet itself — and the inlet increases the variability by a factor of 10 to 100 over normal long-term erosion problems. Depending on the island, if you if you go a mile or more from each end of the ends, that can be quite a bit of the island.
The innovative Inlet Hazard Area identification methods that we developed and reported back in 2018 are now being reviewed and partially implemented by the N.C. Division of Coastal Management.
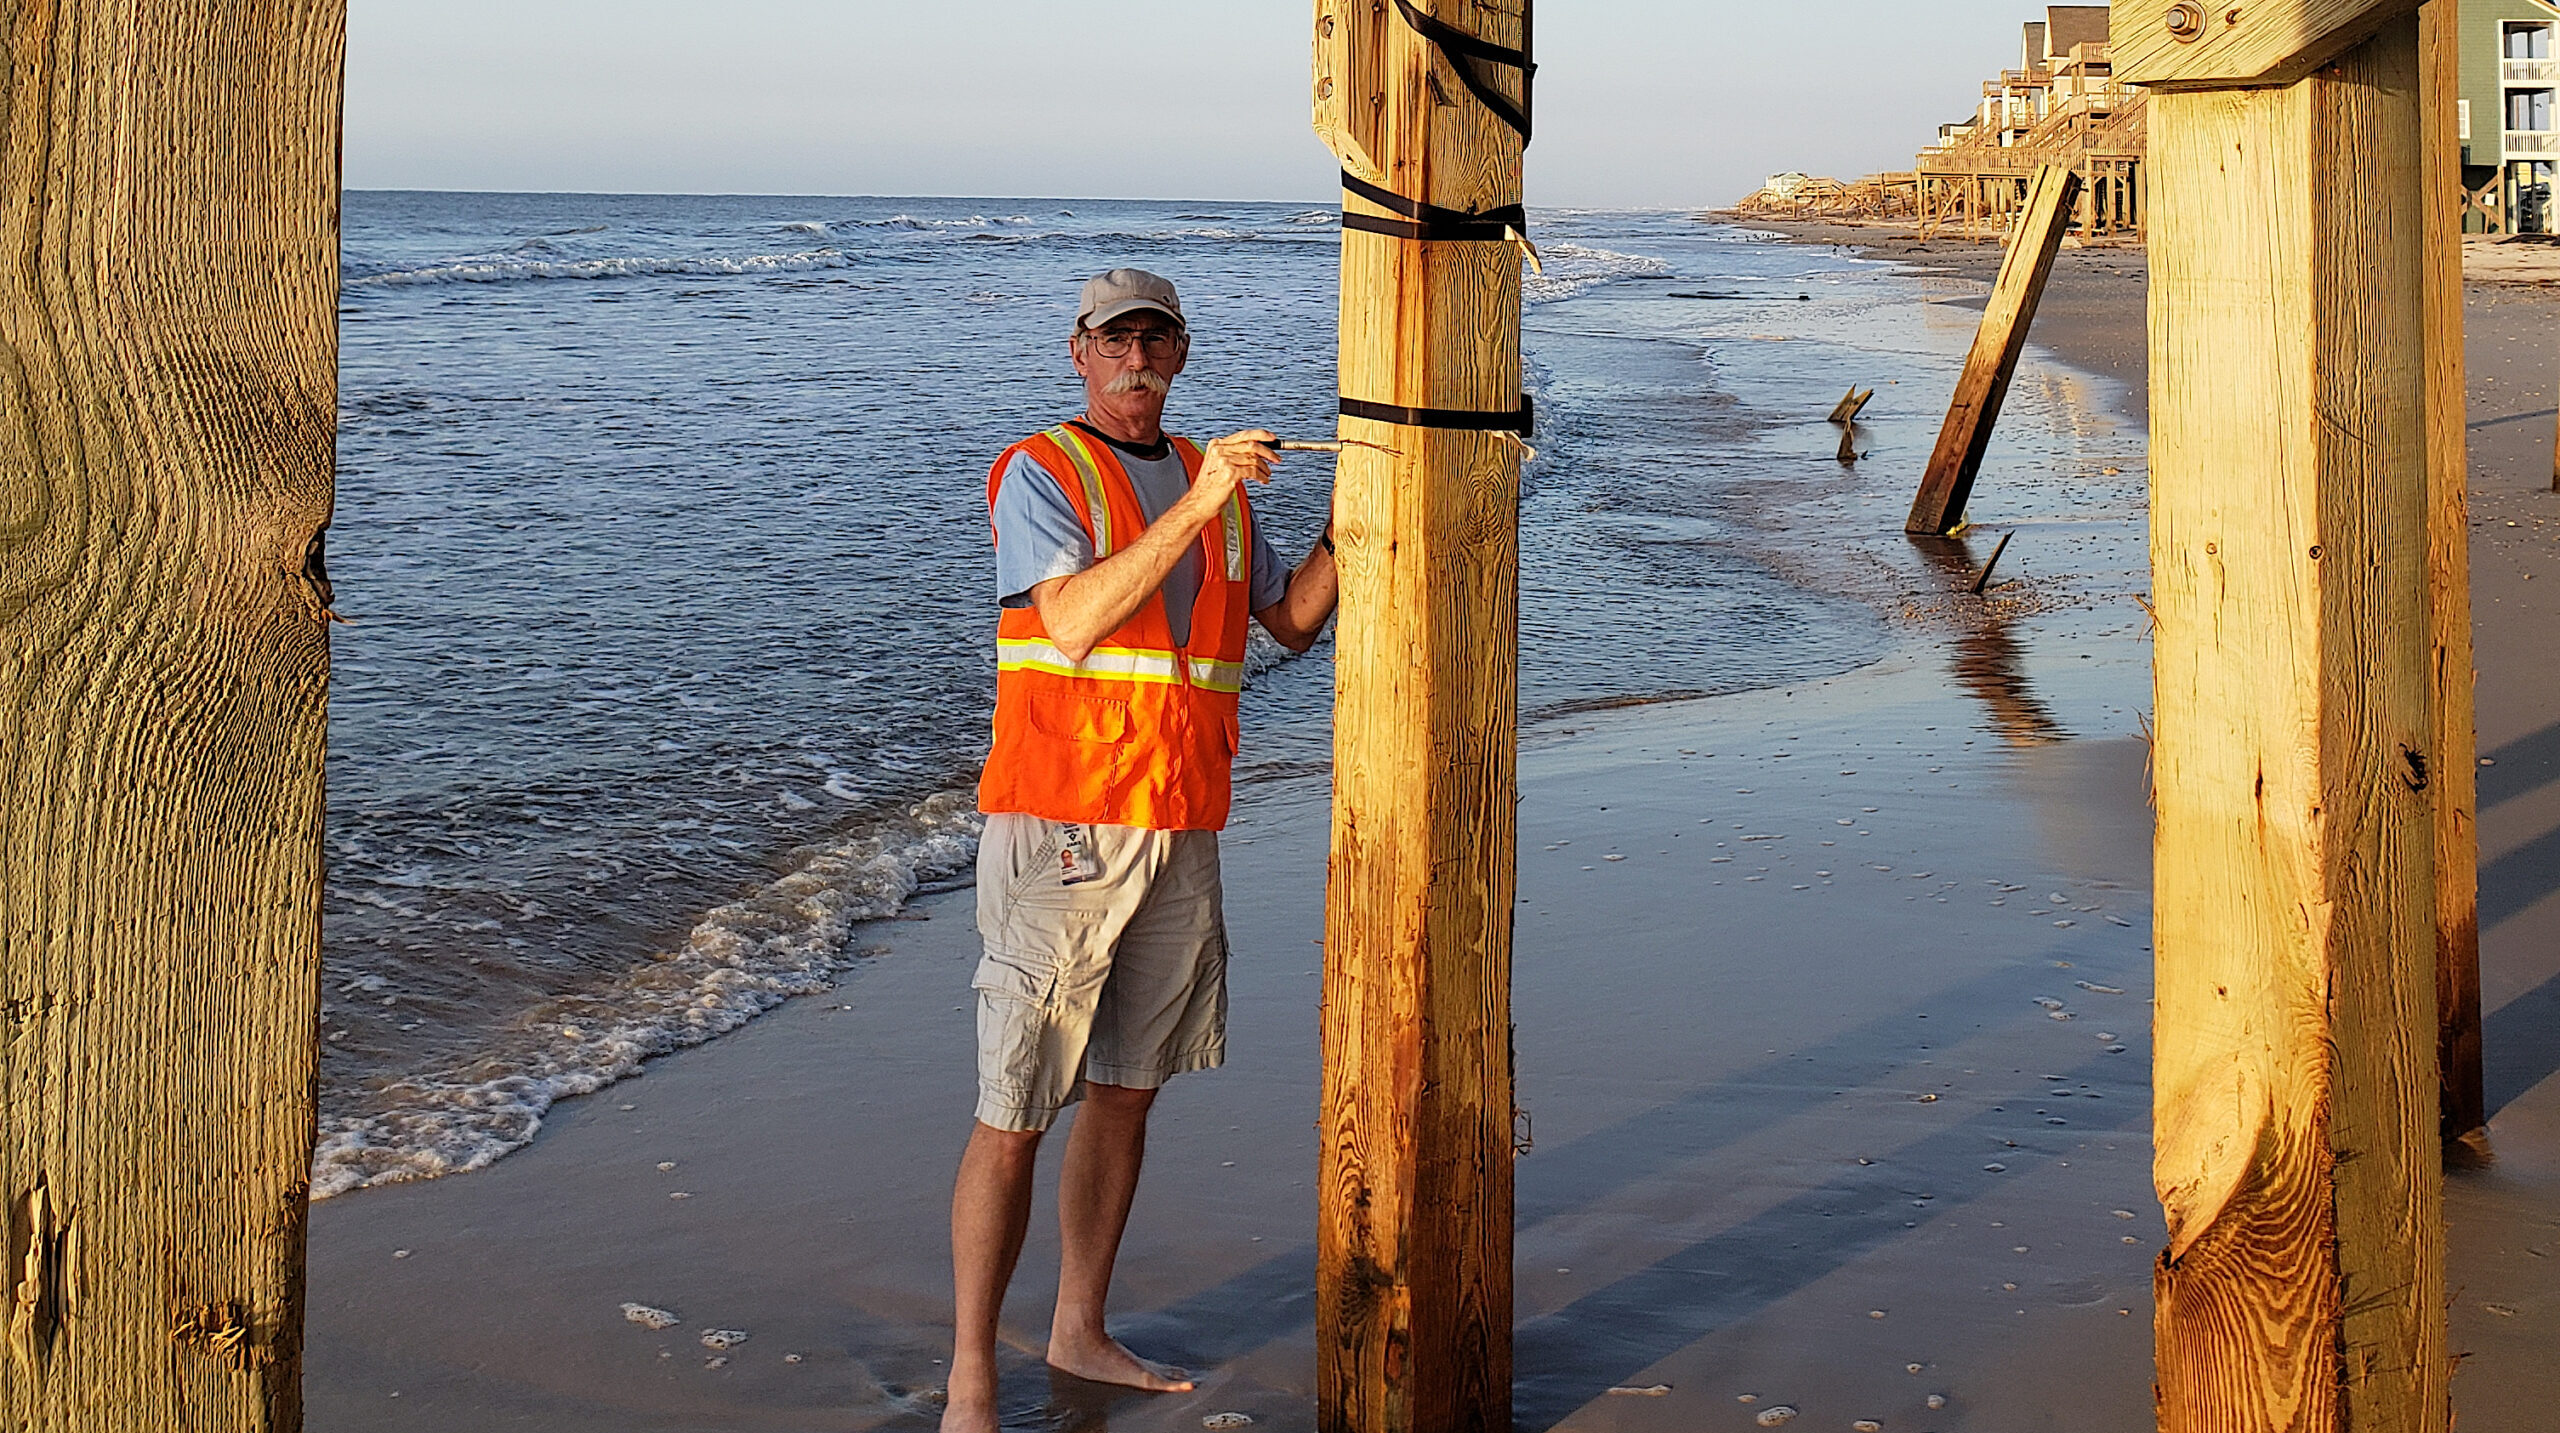
Speaking of inlets, the south end of Topsail Island is one of my better predictions. Forty-two years ago, I advised the Topsail Beach town manager at the time, Tony Caudill, that the dune would not stay in front of some buildings. He agreed and actually gave up on trying to protect the buildings — and instead built the dune to protect the road behind it. The road and the dune are still there.
Now they’re building houses in the area. But that inlet has been moving south at about 90 feet per year for the last 80 years. That’s the last of the migrating inlets in the state, and it appears that it may now be slowing down.
It’s not surprising that we’ve lost a number of inlets in the southern part of the state over the last 10 or 20 years, because they’re still adjusting to the construction of the intercostal waterway in the 1930s. The waterway entirely changed the circulation between the mainland tidal creeks and individual inlets to create a distribution system that could move water more effectively along the waterway to the larger inlets. It’s had a major change on the smaller islands.
Identifying building setbacks on the oceanfront areas of barrier islands was part of one of your early Sea Grant projects.
One of the most useful tools in establishing oceanfront building setbacks is the local long-term erosion rate. The primary threat for things with long lifetimes, like buildings, is the chronic long-term erosion, not just short-term, or storm-induced erosion. With NC State colleagues, I was tasked by the N.C. Division of Coastal Management to update prior erosion shoreline studies that were done when the N.C. Coastal Area Management Act was coming on in the 1970s.
I conducted the initial erosion study that was used for oceanfront setbacks in the state. We were forced to use crude aerial photography analysis tools. I had a UNCW student in the dark room using a photographic enlarger to compare shorelines, something the equipment was never intended to do, and nowhere near what’s available today.
Now it’s done by DCM’s in-house GIS wizards. The setback lines are updated about every five years. The photographs for one of the update studies cost half a million dollars at the time. Now we can get much better photos from Google Earth for free.
You often have spoken about how the most boring buildings are the most important.
Some of the work that I found most interesting has been inspecting areas that have been hit by major hurricanes around the country. Going into these areas, everybody takes pictures of the broken houses. I do that, too, including some fairly spectacular collapses. Many more are less spectacular, but just as important to the individual property owners. What’s been important to me is to look at the same areas for the buildings that survived.
The surviving buildings are relatively boring, and seldom get shown in news coverage. But they’re always examples of successful buildings. Even as you get to the extremes of Hurricane Katrina, there were surviving buildings that managed such conditions with minimal damage or very tolerable damage.
Understanding what was successful is just as important as identifying what is failing in these storms. In our work on Hurricane Ike [during which Rogers collaborated with national experts after the storm struck Texas], we moved from anecdotal observations — building by building, noting what was broken and what worked — to a community scale. We’ve gone from a handful of buildings on any individual report to almost 4,000 buildings after Ike.
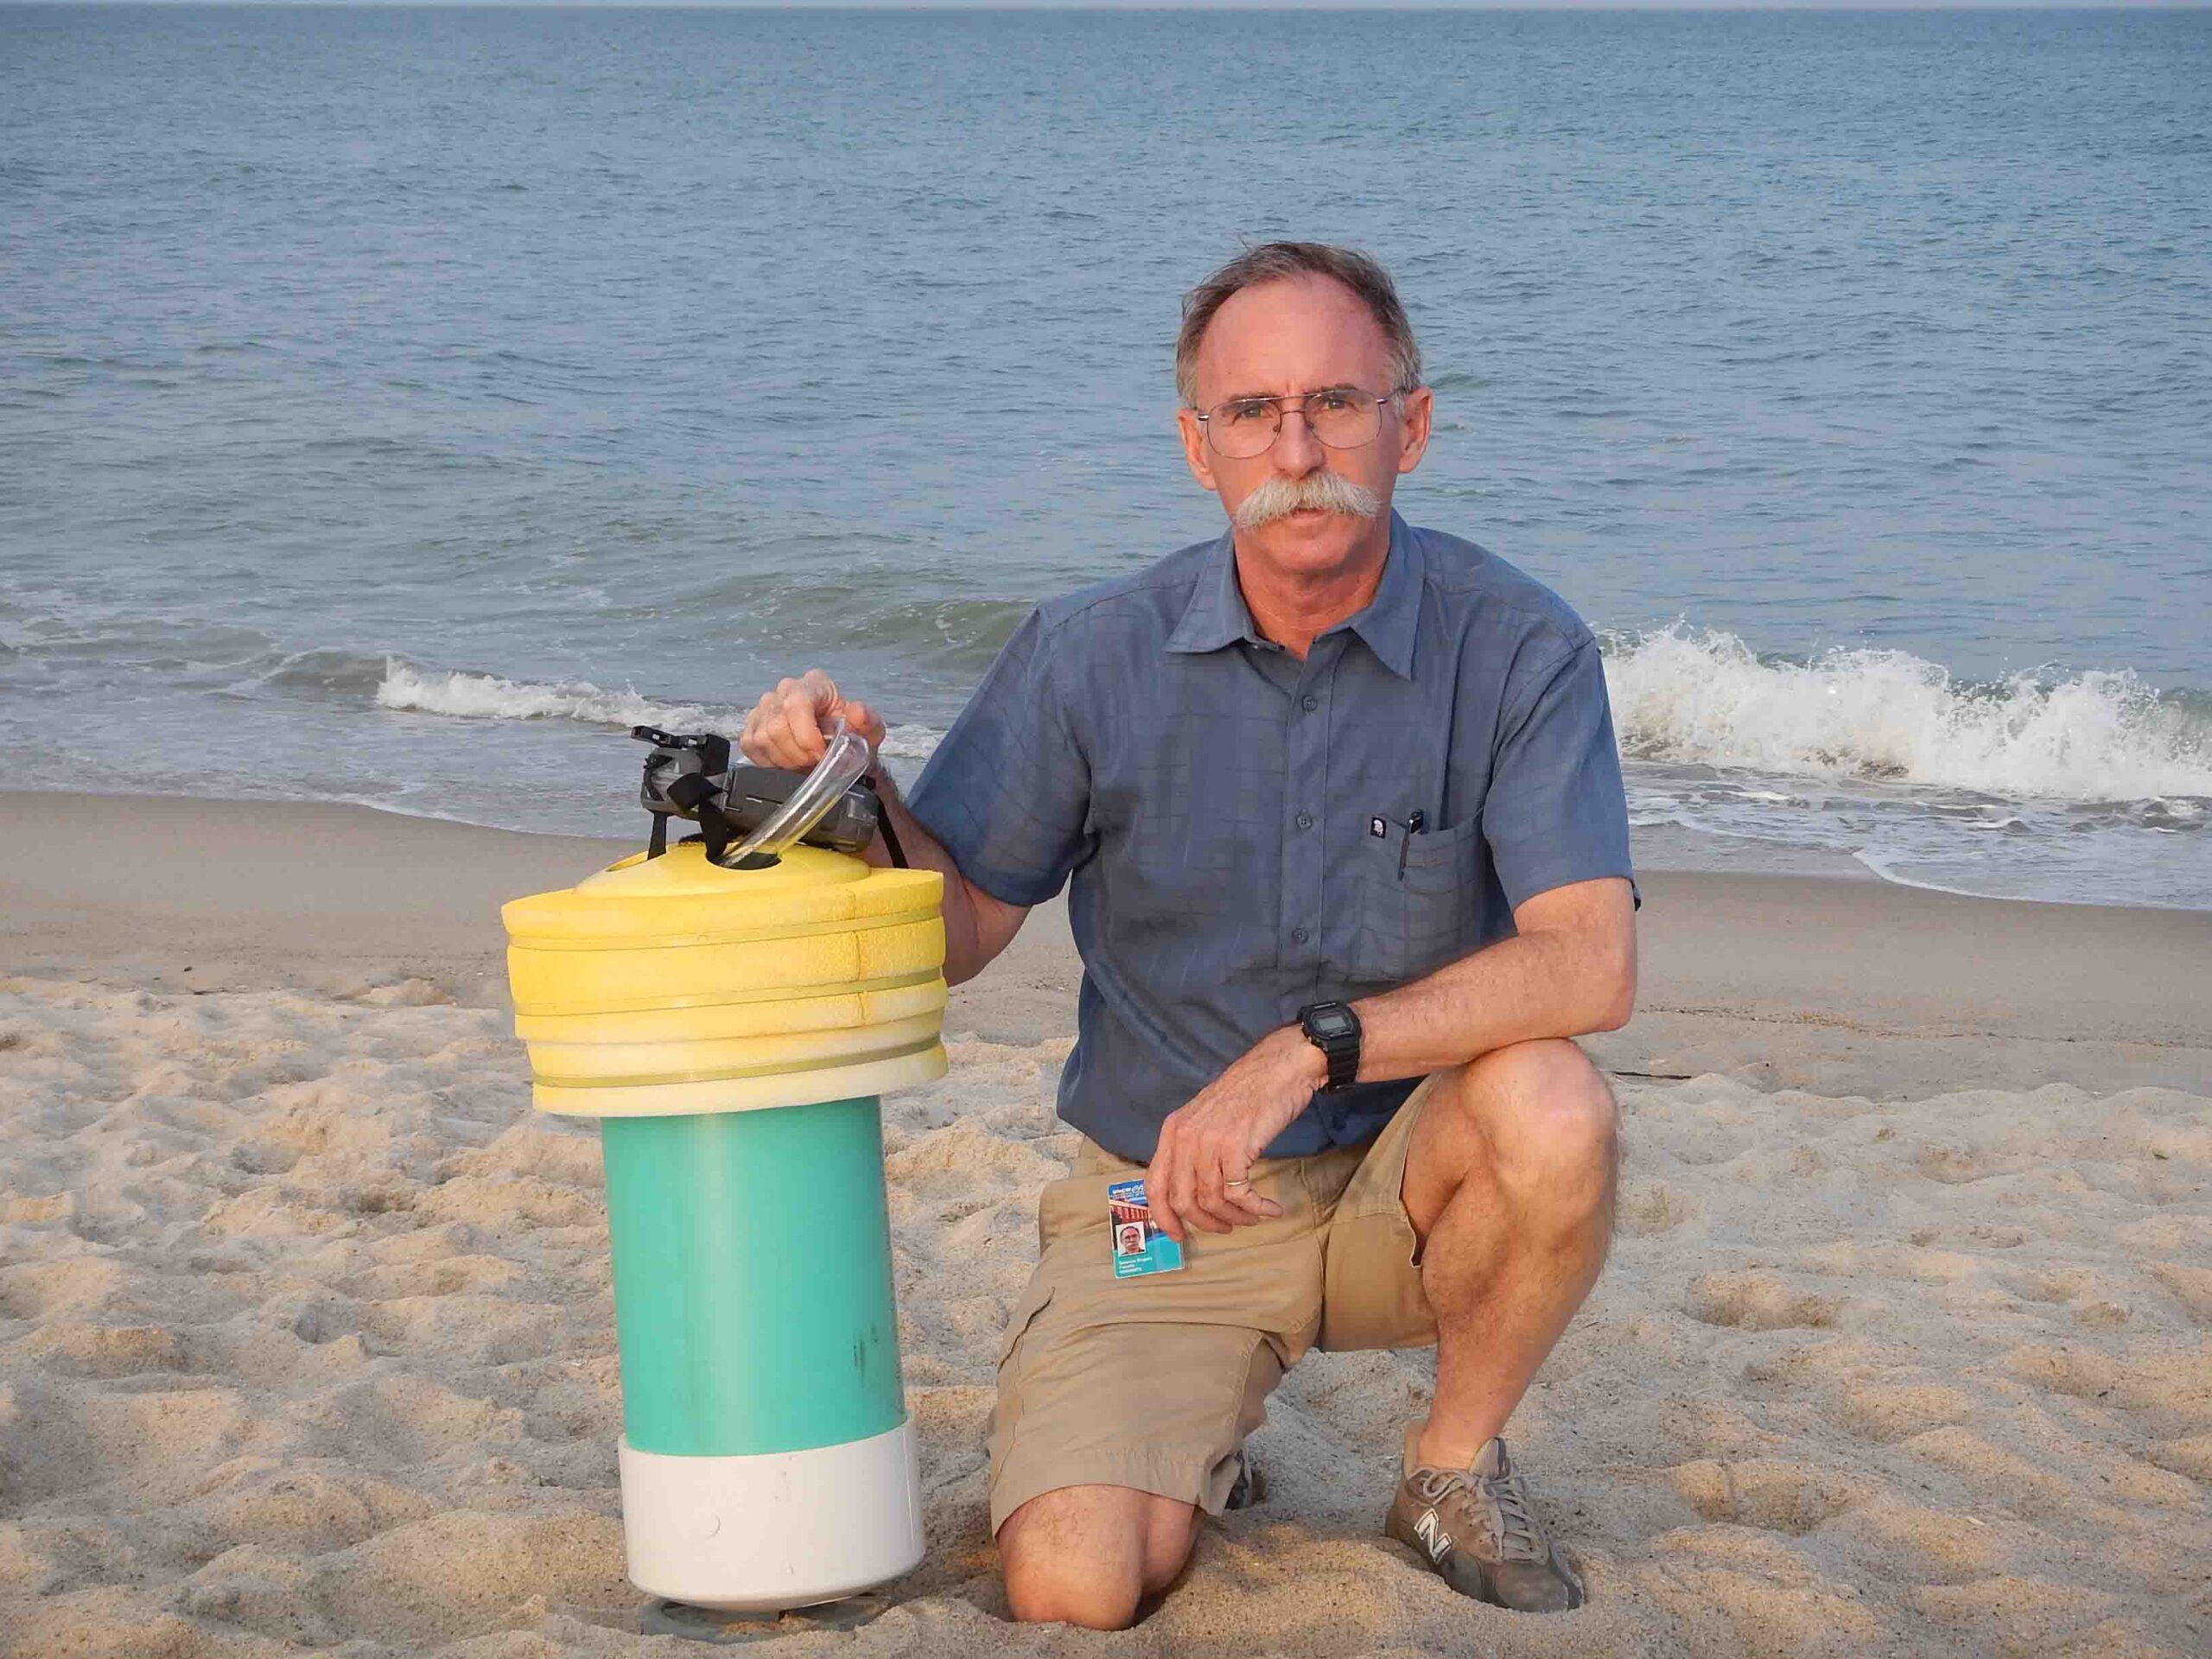
To do that, you must have accurate reporting of conditions. That means using pre-deployed storm gauges — something that I have been involved with over the years and that has become standard practice now by the U.S. Geological Survey. We’re confident that we know what happened in one profile of the Bolivar Peninsula in the middle of Ike, because we have a gauge on the Gulf of Mexico shoreline and one on the bayside, with multiple buildings in between with varying levels of damage.
What have you learned about storm surge and wave modeling?
Sea Grant has supported a number of different studies to improve storm surge models overall. Hurricane Ike, again, allowed us to apply those models to the conditions in that particular storm, because we have gauges to confirm if the model was accurate or where it was accurate. In practice, our ability to predict the wave elevations near the Gulf of Mexico was very good — within a few inches. But the wave models were not as accurate across the peninsula so, there’s still more work to do.
Our work with groups like USGS and others provides wave gauge transects across developed areas. Sooner or later, when these areas get hit, we’ll have not just a gauge on the oceanfront and on the backside, with the estuary. Rather we will have a series of gauges. We’ve been deploying 10 gauges in transects from barrier islands’ oceanfront to mainland communities that have flooding. That’s what it’s going to take to sort out better modeling for these areas during hurricane conditions.
Katie: One response to storm surge and high-wind risk has been updates to the state building codes. What changes have occurred, and what do you anticipate going forward?
In 1986, a committee that I helped get started looked at the 1960s-era building code requirements. Our recommendations — which increased the depth of pilings and the way buildings were constructed in North Carolina — were tested in Hurricane Fran and Floyd in the 1990s. They proved to be effective in the post-storm analysis. You see raised homes all along the coast now.
Looking at the future, by far the big wildcard is climate change and sea level rise, because of the uncertainty of predicting sea level rise. If climate change is at the intermediate, or, particularly, the higher ranges, anything we do for the lower ranges, would be wasted effort. If we go at it in the other direction to plan for the highest levels of sea level rise increase, that’s basically abandoning large parts of the mainland and most of the barrier islands. Which end of the spectrum that local and state officials use will be important in my successor’s career.
You are a well-known expert on rip currents here and nationally. What have you learned?
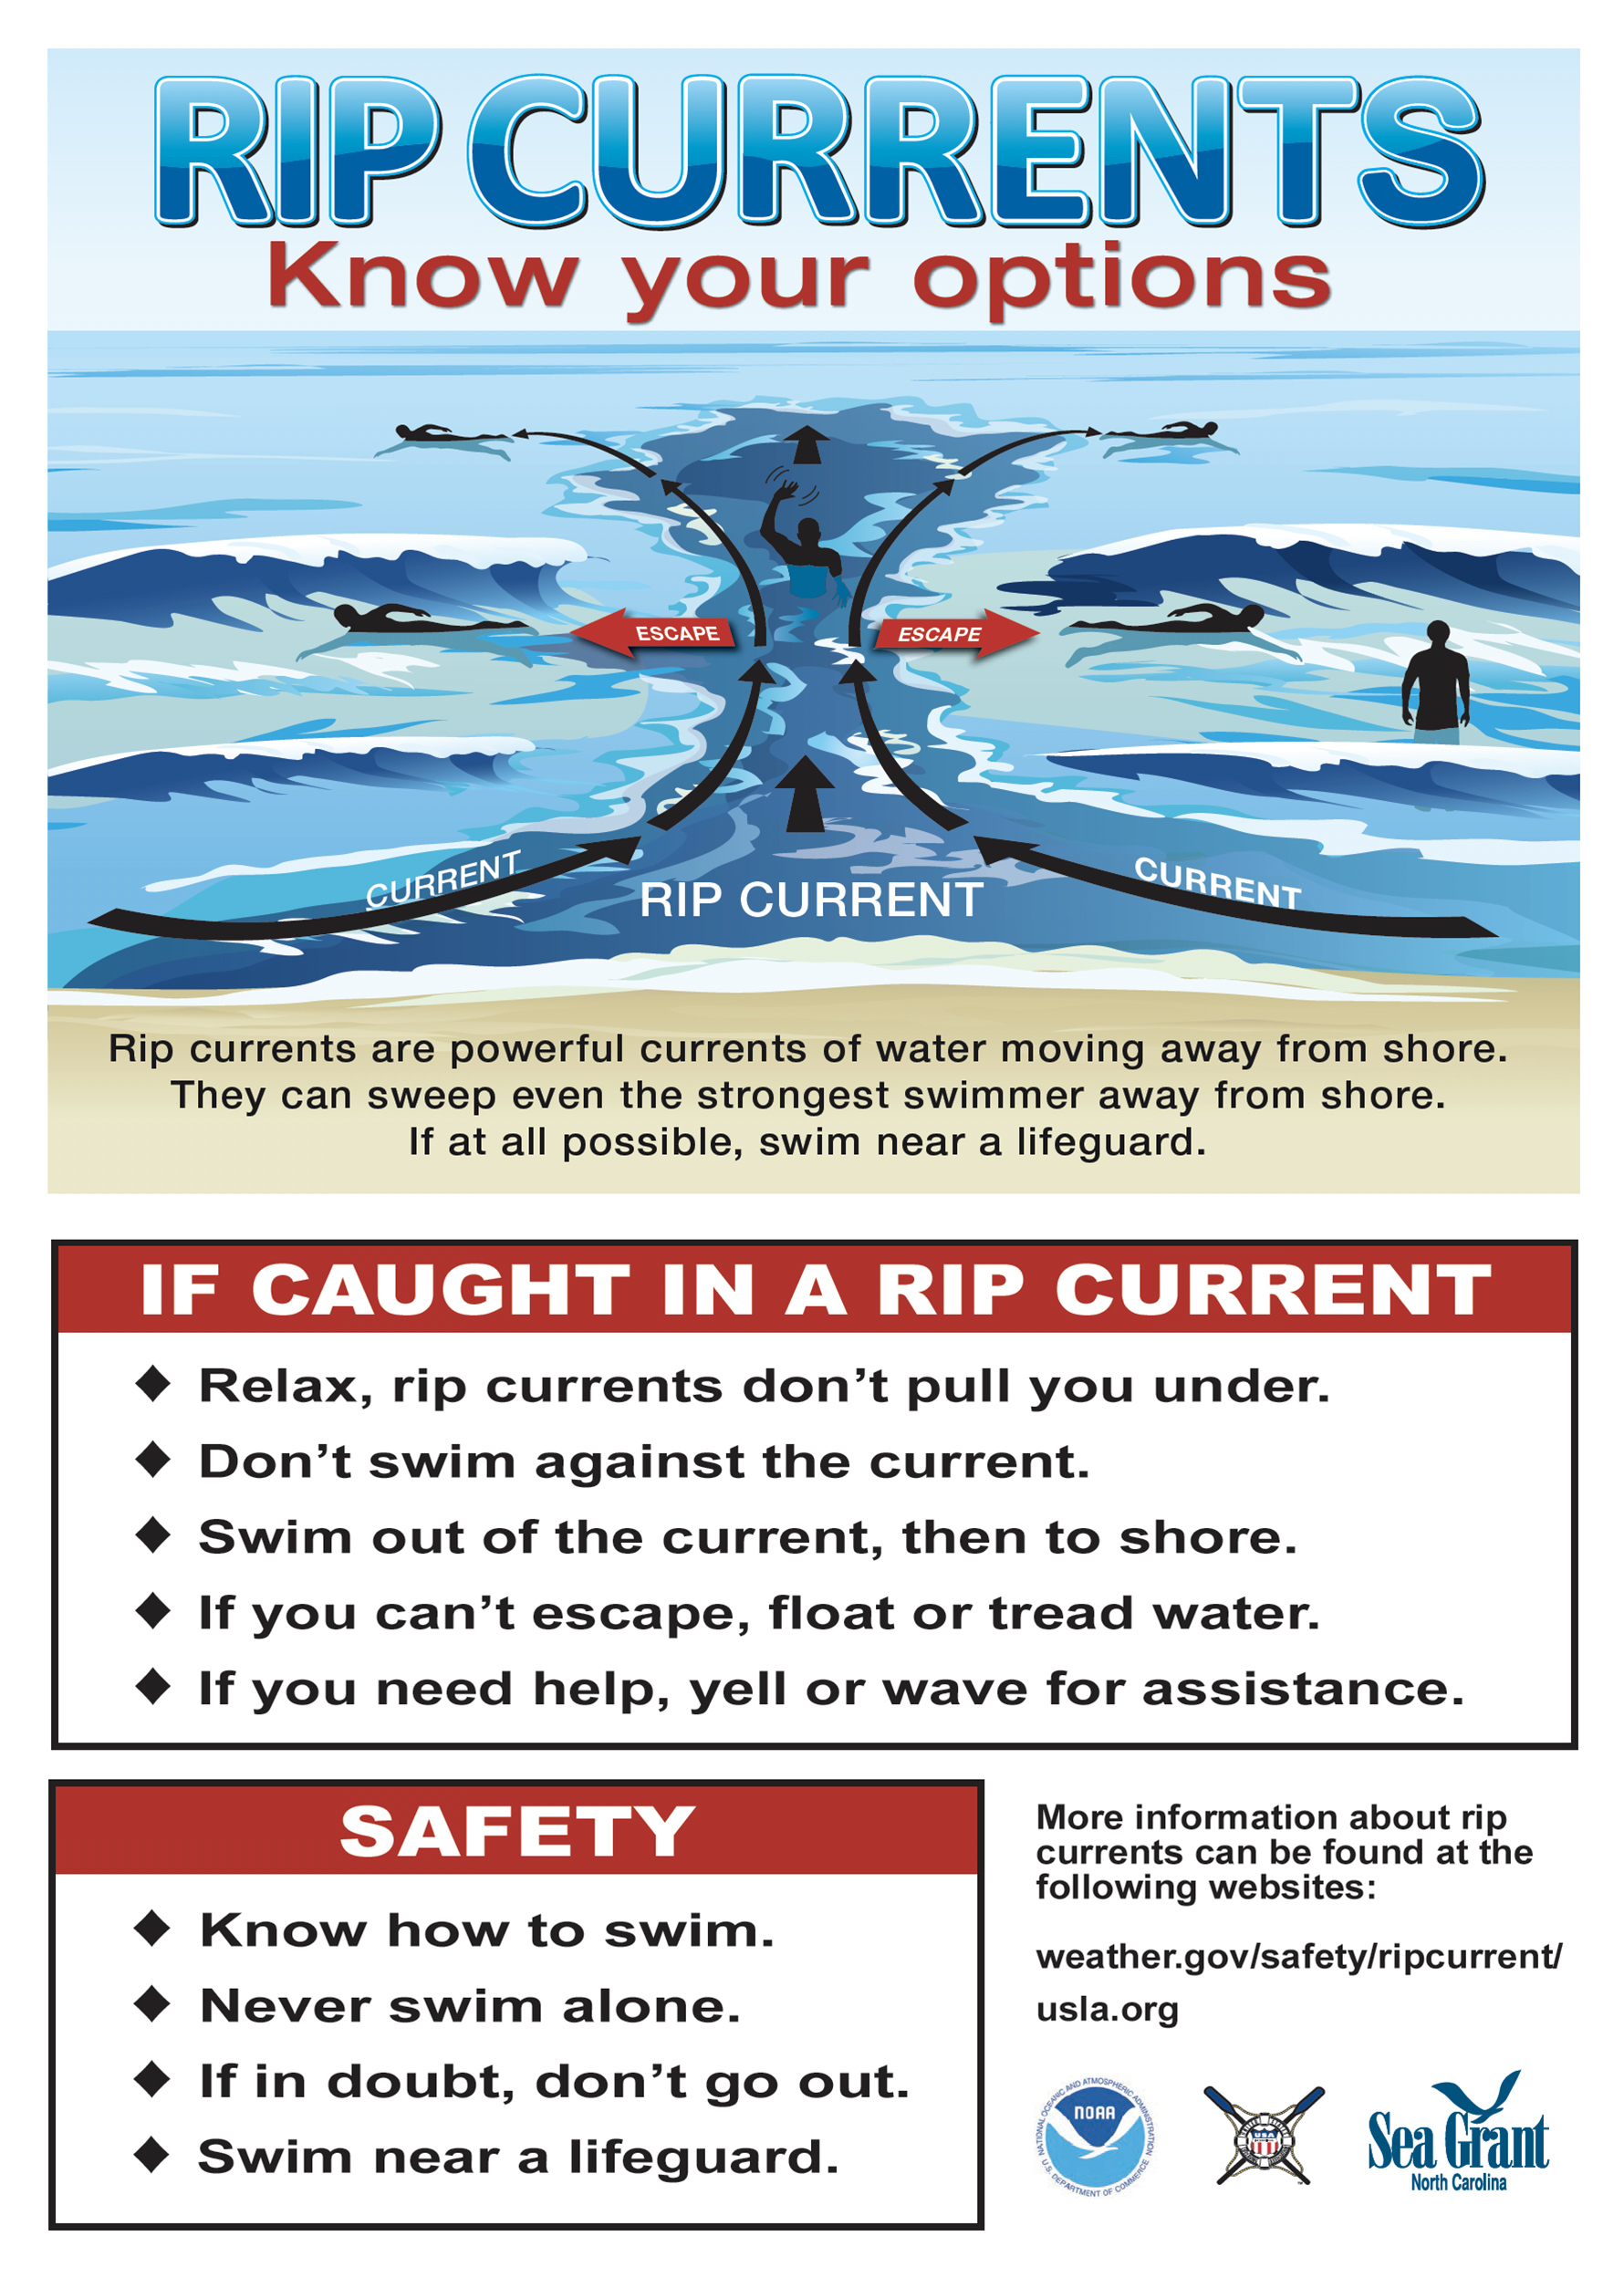
Rip currents are a major beach hazard — one of very few hazards on what’s otherwise a relatively safe place for recreation. They are threats to people, and they’re very difficult to identify. We’re losing lives, in North Carolina, nationally, and internationally.
We worked for many years with partners here in North Carolina, producing a whole series of warning posters and materials that evolved to better convey the risk to beach goers. Around 2004, we agreed to work with NOAA at the national level to help produce and update national products that could be used by any community as warning materials. Since then, North Carolina Sea Grant has helped partners produce warning information on signs and magnets, even on sunglasses and dog leashes. [See the inside back cover of this issue.]
There is an endless group of new beach-users coming to the coast. Many are coming from inland areas, with no concept of what a rip current is or what to do if you happen to get caught in one. I’m pleased that most of the communities in North Carolina are using some form of those signs, posted at hundreds of public walkways and lifeguard stands around the state, to convey the science of what rip currents are, and what to do if you get caught in one.
To be safe, the best strategy is still to swim parallel to shore, get out of the rip current absolutely, as soon as possible — and the U.S. Lifesaving Association and NOAA have used that for warning guidance.
My grandkids will have a rip current warning magnet on their refrigerator. Strong science communication and outreach will be needed.
- NC Flood Inundation Mapping and Alert Network
- N.C. Continuously Operating Reference Station network of Global Navigational Satellite System
- Rogers’s work on rip currents (and other rip current modeling efforts)
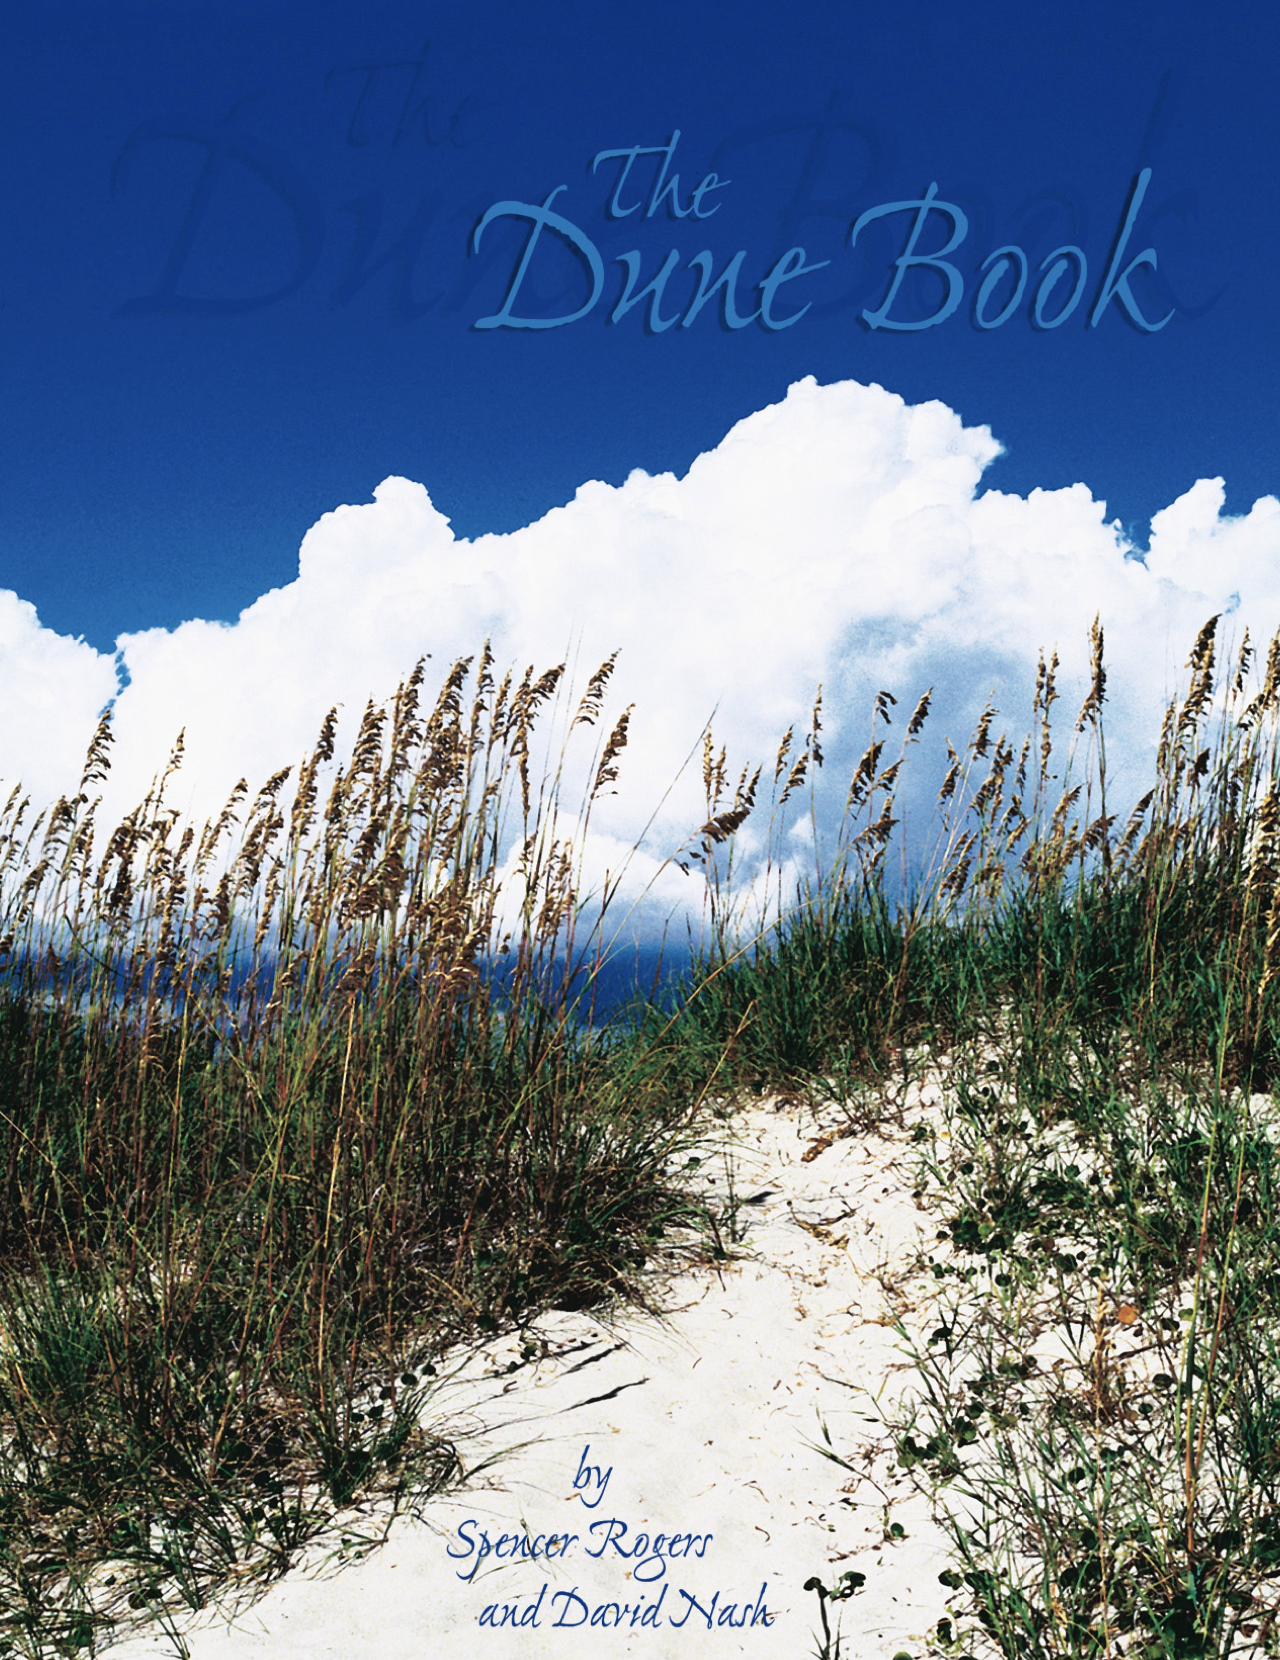
- The Dune Book
- Rogers on coastal construction and insurance options
Katie Mosher has led the North Carolina Sea Grant communications team since 1998. During her tenure, she has been a writer, editor, mentor, and collaborator, including ongoing service on the national rip currents task force. An Ohio native, she initially came to Raleigh as a daily news journalist.
- Categories:
