
Bridge Crossing Modeling Study
The content below was prepared by J. Jack Kurki-Fox and edited by Barbara Doll, Julie Leibach, and Jonathan Page.
There are more than 10 road/highway and railroad bridges crossing the Neuse River between Smithfield and Kinston. These bridges have embankments to elevate the road surface across the floodplain leading up to the river channel. The embankments obstruct water flow on the floodplain, thereby potentially increasing the water level upstream of the bridge structures during extreme events, which can exacerbate flooding.
Concern that bridges are worsening flooding has been raised in many communities across eastern North Carolina. A team led by Barbara Doll of North Carolina Sea Grant and NC State University’s Department of Biological & Agricultural Engineering has evaluated bridges in several towns using hydraulic models to determine if modifying the bridges (e.g., increasing their span and/or raising their elevation) would reduce flooding.
Bridges modeled include the U.S. Highway 301, railroad and Interstate 95 bridges south of Smithfield; the Arrington Bridge Road bridge near Goldsboro; the U.S. Highway 70, U.S. Highway 258, and railroad bridges in Kinston; and the N.C. Highway 43 bridges over the Neuse River and Swift Creek in Craven County. Read an article in Coastwatch magazine about this study.
Because of the close proximity of several bridges in each municipality, modeling has revealed that minimal to no change in upstream flooding can be achieved by modifying a single bridge in many cases. More significant (but still minimal) reductions can only be achieved by modifying several bridges in each community. The table below shows the expected range of water surface elevation reductions upstream of the bridges that can be achieved during a Category 1 hurricane-scale event (e.g., Hurricane Matthew) from modifying a single bridge compared to modifying multiple bridges.
Learn more about mitigation strategies related to coastal riverine flooding.
| Community/Bridge | Existing Span Width (feet) | Modified Span Width (feet) | Water Surface Elevation Reduction (feet) | Upstream Point of Reference |
|---|---|---|---|---|
| Smithfield | U.S. 70B | |||
| U.S. 301 | 300 | 900 | 0.0 | |
| I-95 | 300 | 900 | 0.0 | |
| I-95 | 350 | 2,350 | ||
| U.S. 301 and railroad bridge combined | – | – | 1.0 | |
| U.S. 301, railroad bridge and I-95 combined | – | – | 1.4 | |
| Goldsboro | Arrington Road | |||
| Arrington Road bridge | 300 | 850 | 0.0 | |
| Kinston | U.S. 70 | |||
| U.S. 70 | 700 | 2,000 | 0.3 | |
| King Street | 670 | 3,470 | 0.7 | |
| Queen Street | 600 | 2,050 | 0.2 | |
| Railroad bridge | removed | 0.0 | ||
| U.S. 70, King Street and Queen Street combined | – | – | 1.2 | |
| Craven County | ||||
| N.C. 43 (Neuse River) | 900 | 4,400 | 0.1 | N.C. 43 |
| N.C. (Swift Creek) | 230 | 3,230 | 0.7 | |
| N.C. 43 and railroad bridge on Swift Creek | – | – | 0.9 | N.C. 43 |
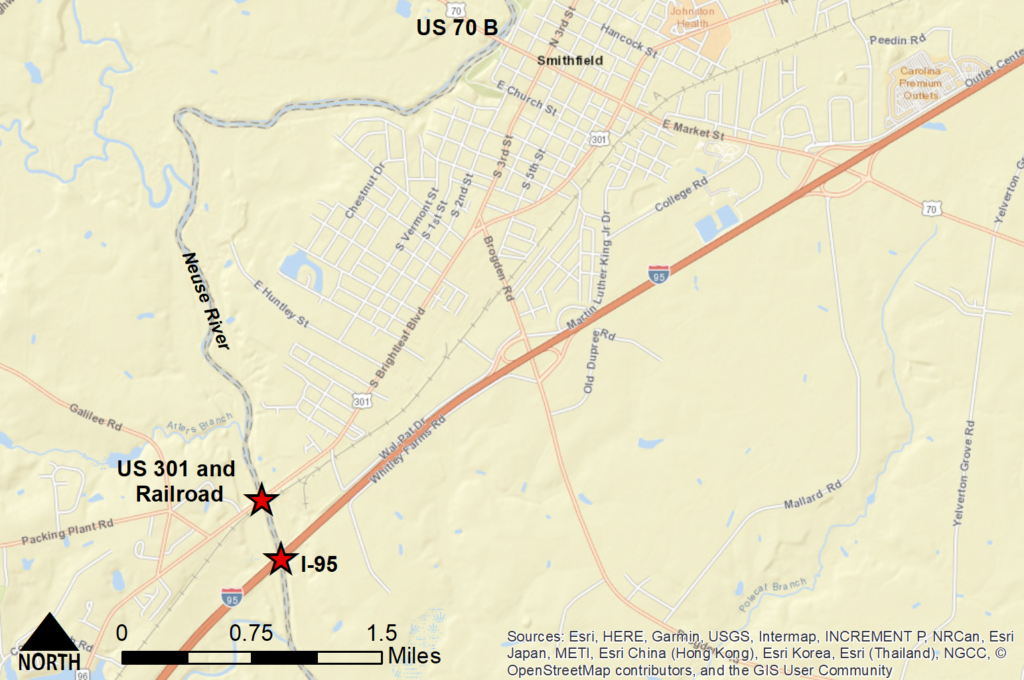
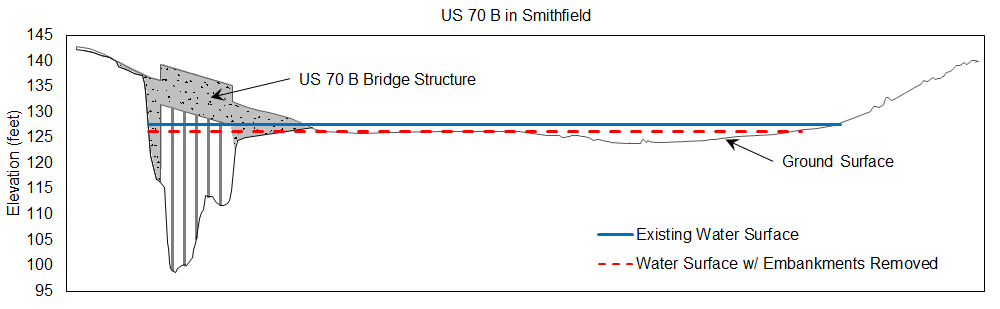
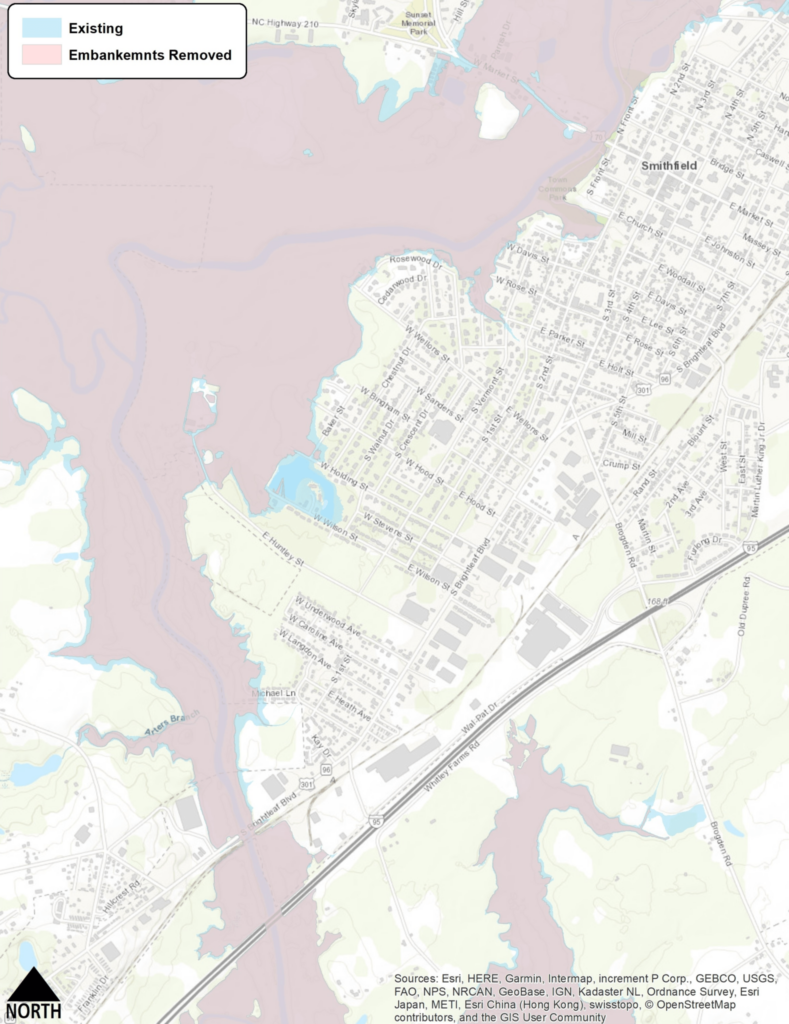
Smithfield
In Smithfield, three bridges along the Neuse River were modeled: U.S. 301, railroad and I-95. The modification of all three bridges resulted in a maximum estimated 1.4-foot reduction in water surface elevation, but failed to alleviate flooding across U.S. 70B west of town, as a drop in water surface elevation of more than 3 feet is required to prevent overtopping of this road during a Hurricane Matthew-scale event. In addition, the aerial extent of flooding changes very little from the modifications.
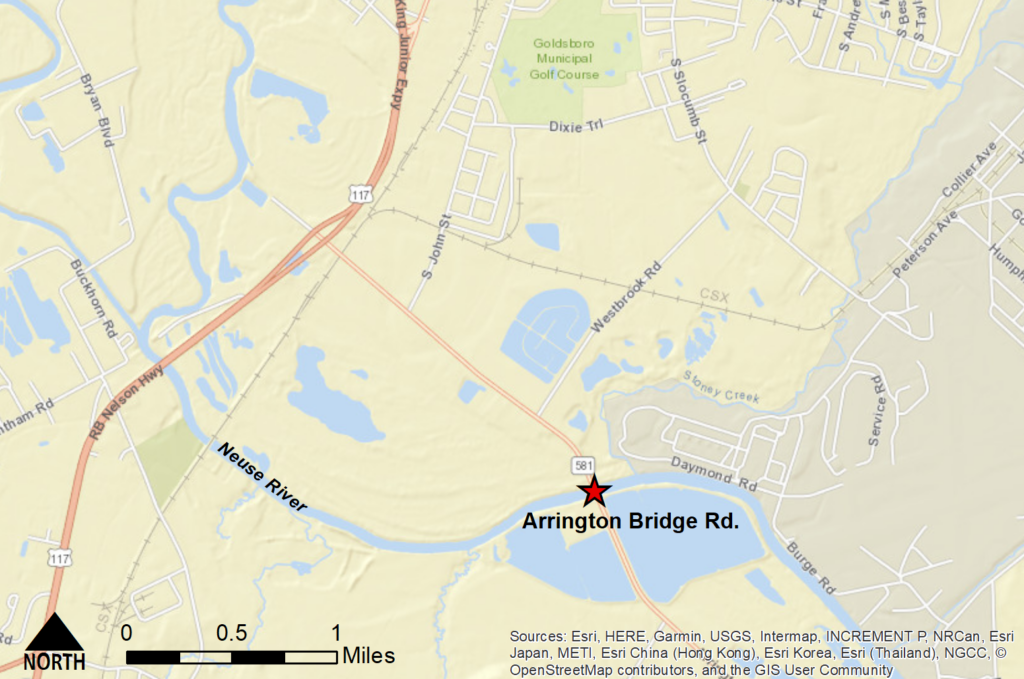
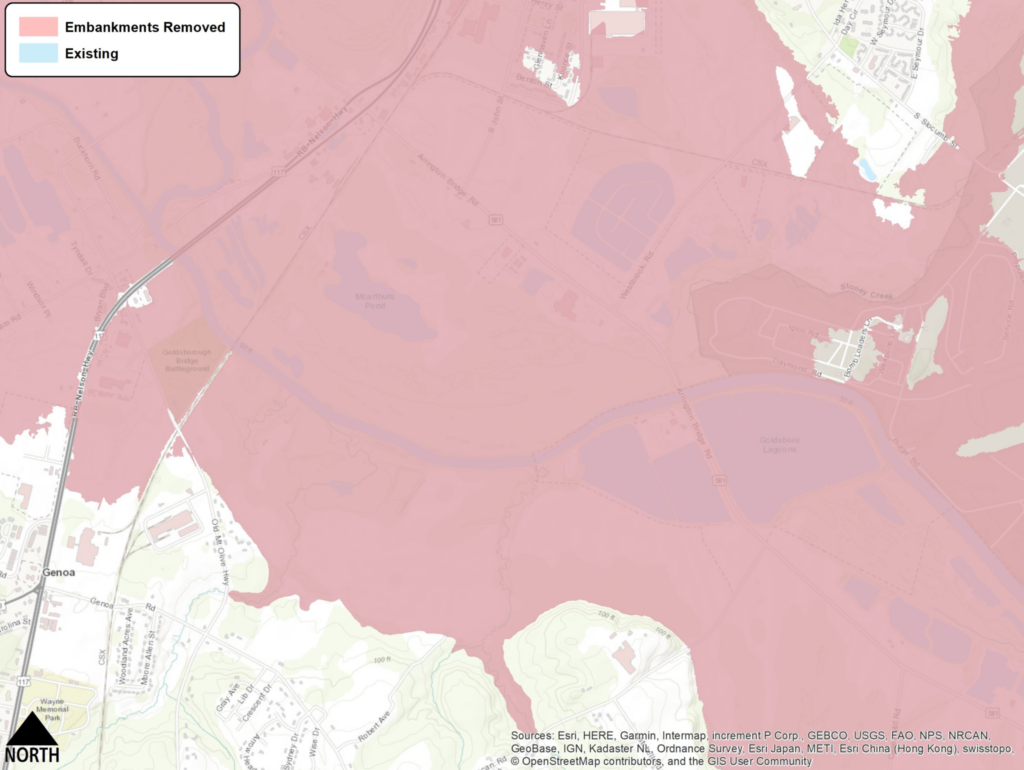
Goldsboro
In the City of Goldsboro, Arrington Bridge Road bridge was identified as a potential flow obstruction. Modeling results indicate that no change in water surface elevation will result from removing the embankments and increasing the span of this bridge. This is likely due to the flow constriction of the river channel just downstream of the bridge, which causes backwater downstream of the bridge.
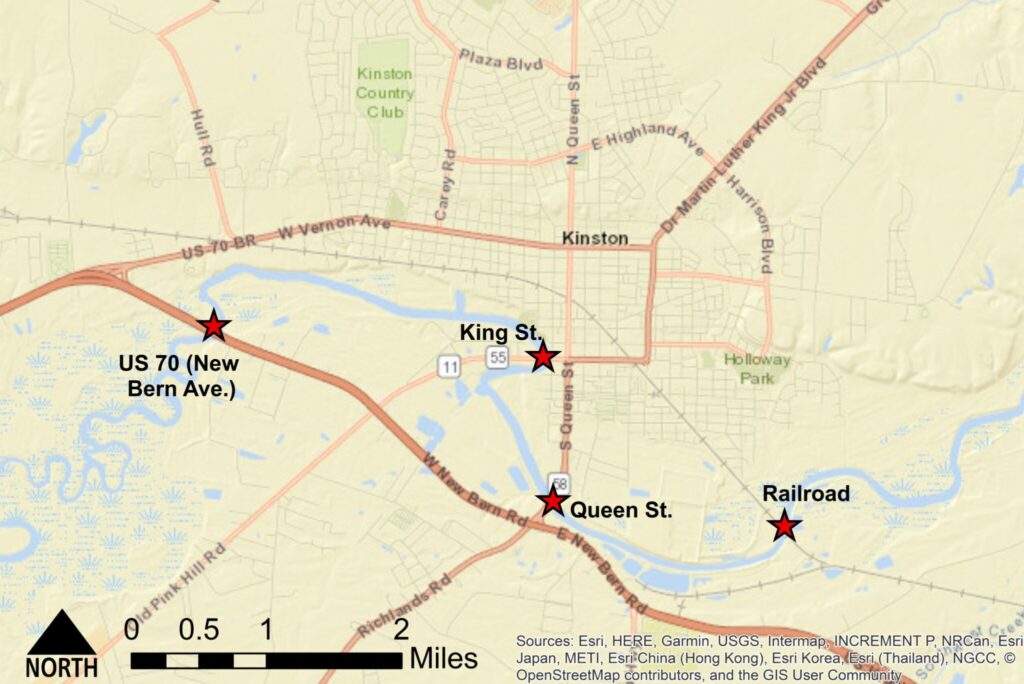
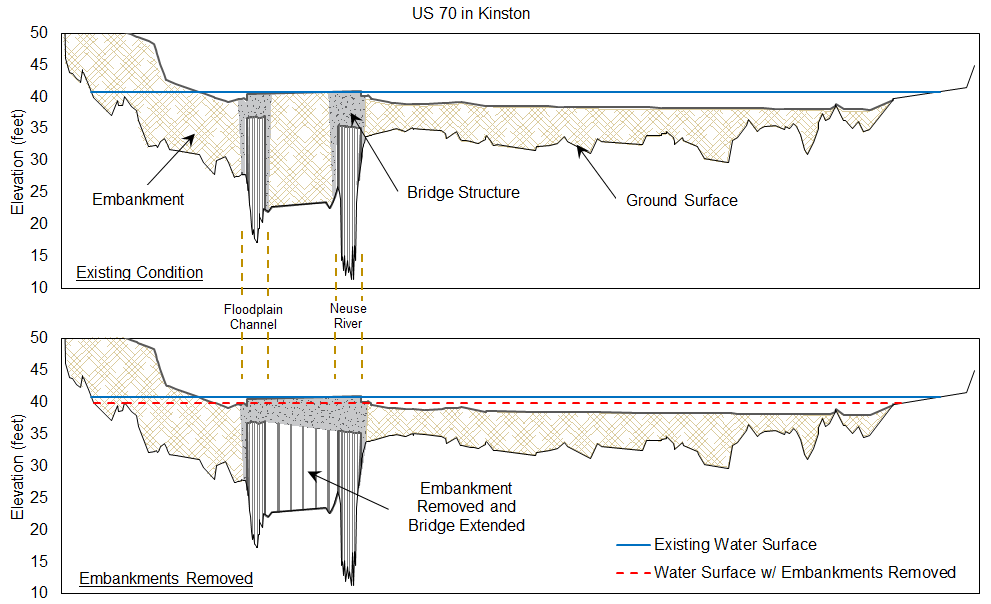
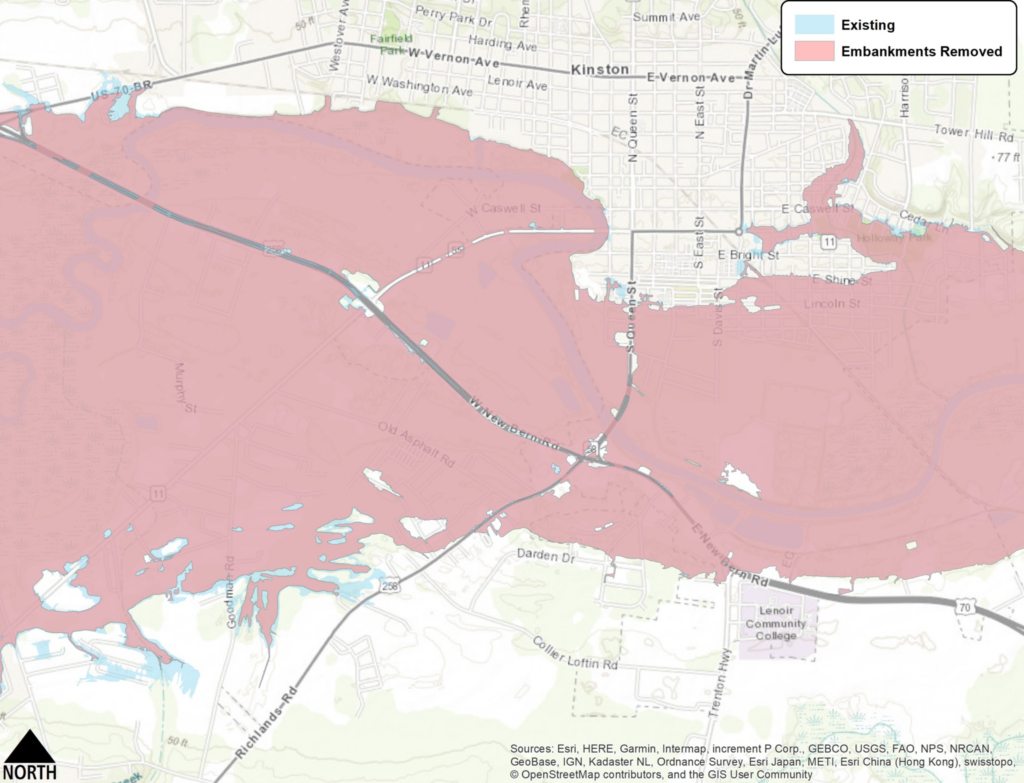
Kinston
In Kinston, four bridges along the Neuse River were modeled: U.S. 70 (New Bern Avenue), King Street, Queen Street and the railroad bridge southeast of town. Even though the railroad bridge was perceived as exacerbating flooding during extreme events, model simulations of the river hydraulics with the railroad bridge completely removed resulted in no change in water surface elevation for any of the flooding events evaluated.
For many events, a substantial portion of the total discharge flows over the bridge and does not cause any backwater upstream. In contrast, the modification of all three road bridges resulted in a maximum estimated 1.2-foot reduction in the water surface elevation upstream of U.S. 70 during a Hurricane Matthew-scale event. Despite this reduction in water surface elevation, the aerial extent of flooding changes very little due to the modifications.
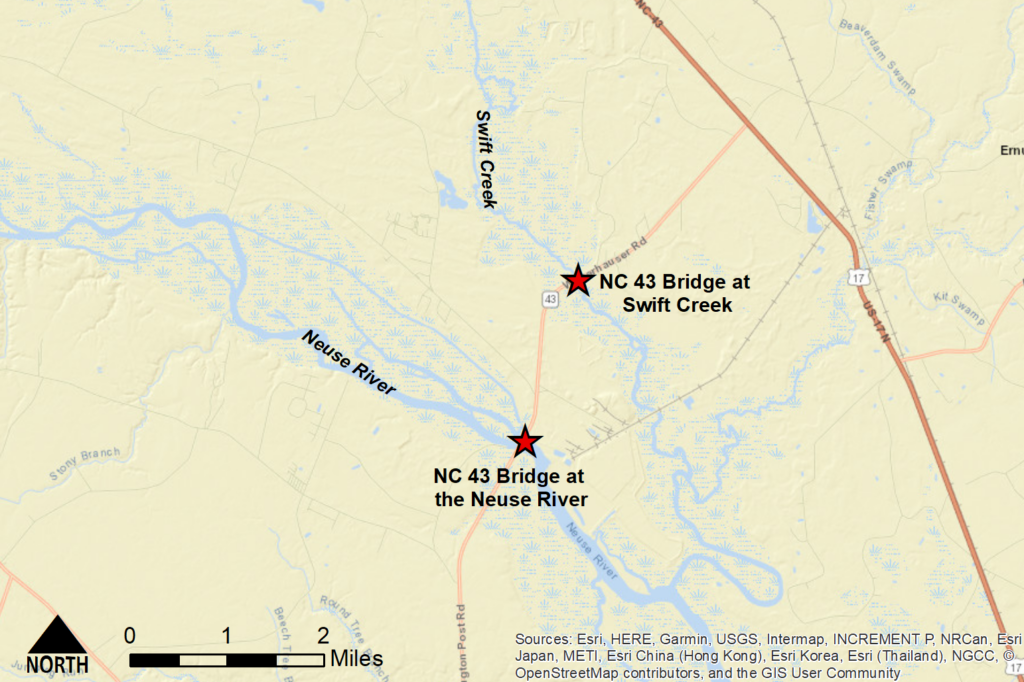
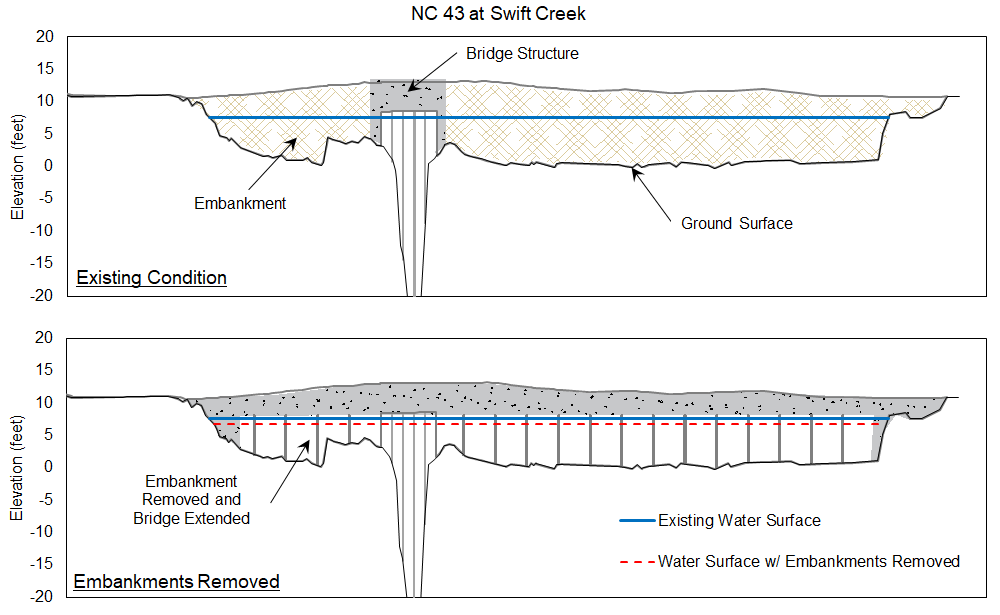
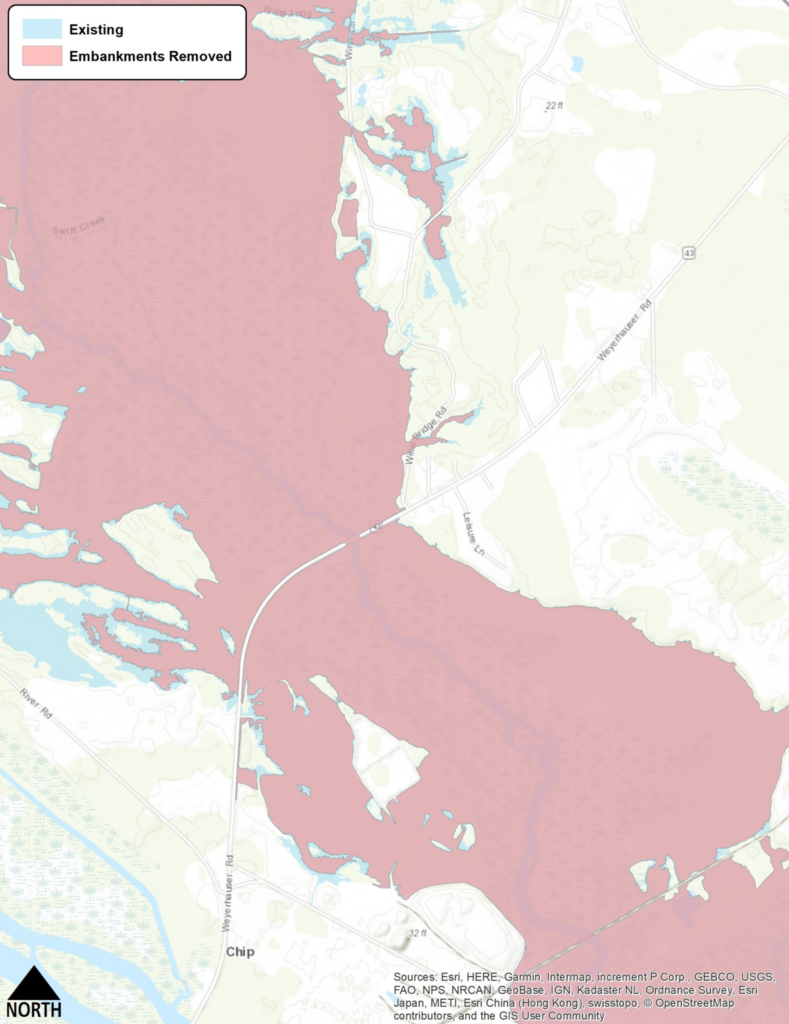
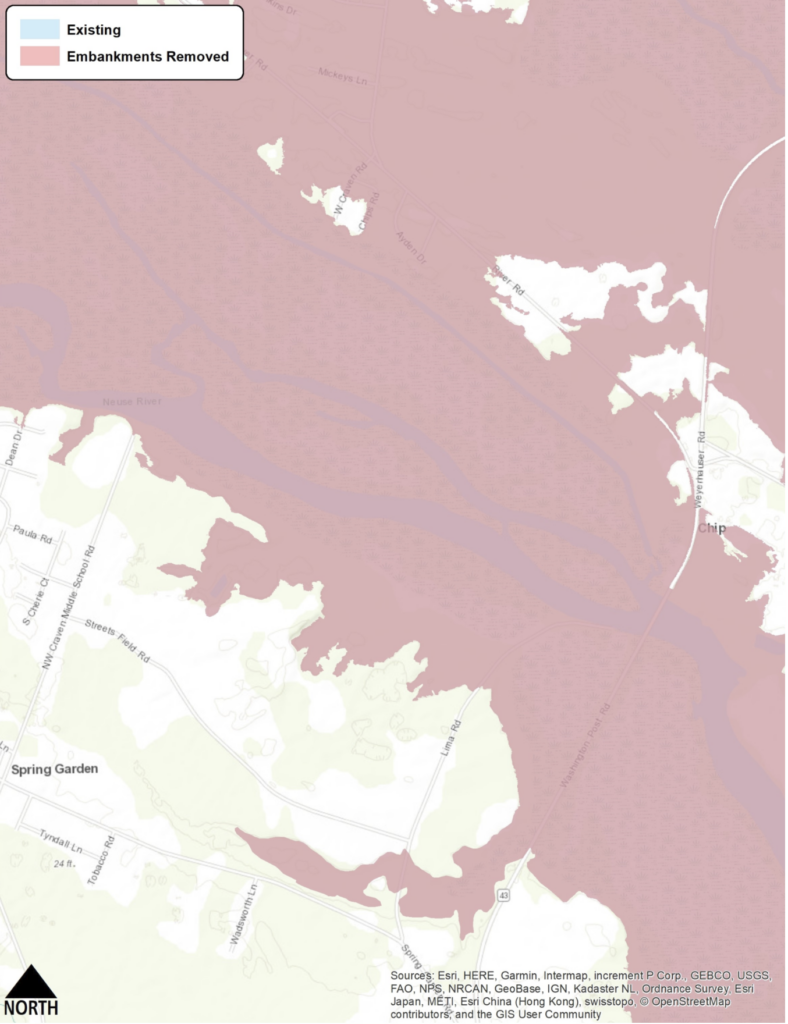
Craven County
Two bridges along N.C. 43 (Weyerhaeuser Road) in Craven County on Swift Creek and the Neuse River and one railroad bridge located 1.5 miles downstream of N.C. 43 on Swift Creek were modeled. The modification of both of the Swift Creek bridges (N.C. 43 and the railroad) resulted in a maximum estimated 0.9-foot reduction in the water surface elevation during a Hurricane Matthew-scale event. However, this water surface change resulted in minimal changes to the aerial extent of flooding due to the shape of the floodplain and the surrounding terrain. Despite extensive modifications to the N.C. 43 bridge over the Neuse River, only a 0.1-foot reduction in water surface elevation resulted for a Hurricane Matthew-scale event, and there was no distinguishable change in flood inundation because of backwater from downstream.
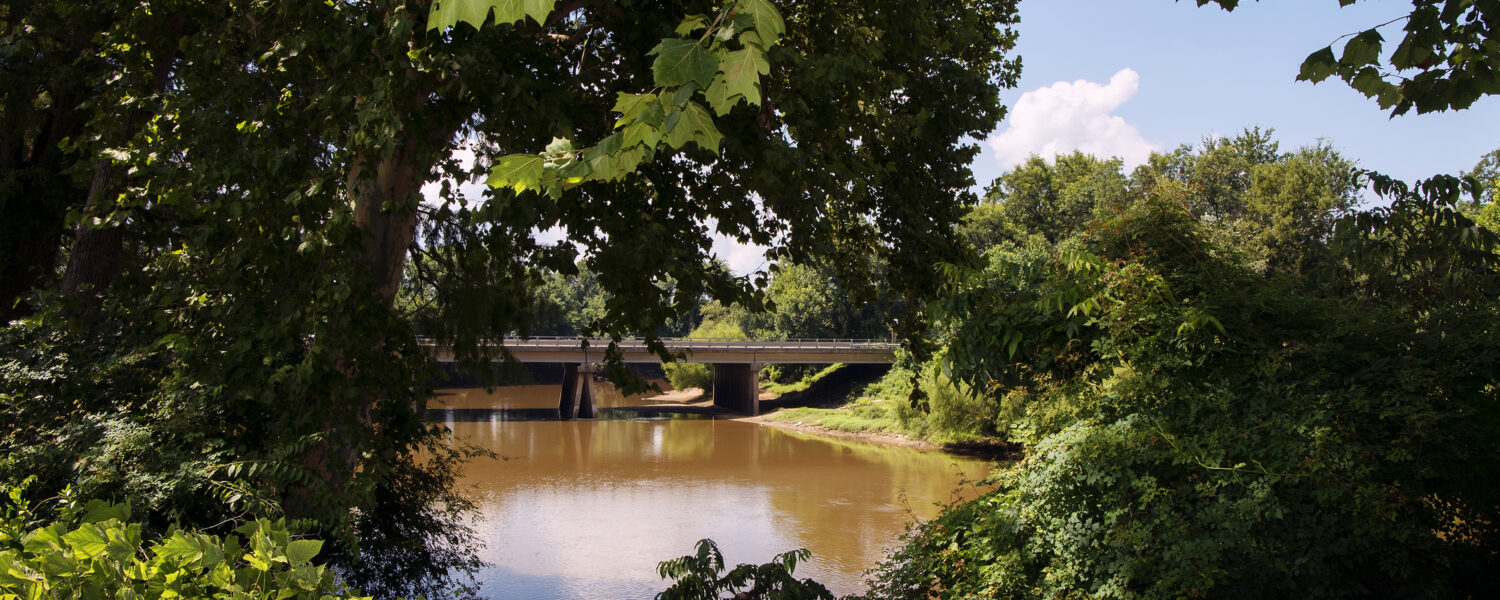
Lead photo: A bridge over the Neuse River in Kinston. Public Domain