
Lesson 10: Assessing Profitability of a Mariculture Operation
Objectives
By the end of this lesson, students will be able to:
- Identify factors that affect marine aquaculture business profitability.
- Conduct a sensitivity analysis using Excel or Google spreadsheets to determine how specific factors affect profitability.
- Explain how demand and supply for aquaculture products affect the product’s price.
Overview
In operating a marine aquaculture business, the manager must be familiar with the biological and environmental requirements of the species they grow, as well as the factors that affect profitability of their enterprise. If their business is not economically viable, it will not be in operation for long.
In this activity, students will use real data from oyster farming operations in Virginia to examine the costs of doing business. They will become familiar with farm enterprise budgets, which are common business planning tools used in agribusiness.
Grade Level: 11-12
Duration: 2 class periods
Career and Technical Education Standards: Relevant to Agricultural Education courses
Vocabulary
consumer demand: willingness and ability of consumers to purchase a quantity of products
direct relationship: relationship between two variables in which one increases or decreases, and the other goes in the same direction
farm enterprise budget: estimation of receipts (income), costs and profits associated with the production of agricultural products
fixed costs: expenditures that a business incurs, such as rent, that are constant whatever the quantity of goods or services produced
inverse relationship: relationship between two variables in which one increases or decreases, and the other goes in the opposite direction
market supply: amount of product available for consumers to purchase
operating expenses: expenditures that a business incurs as a result of performing its normal business operations, and that vary with the amount produced; also known as variable costs
profit or return on investment: performance measure used to evaluate the efficiency of an investment; difference between the amount earned and the amount spent in buying, operating or producing something
scarcity: the basic economic problem — the gap between limited resources and theoretically limitless wants
sensitivity analysis: study of how changes in the values of independent variables result in uncertainty in the output of an economic model
Background
As with any business venture, running a successful aquaculture operation means juggling a number of different economic variables. For example, growers must account for the money they invest into the business to keep it running while also keeping track of their earnings.To ensure that their business is profitable, growers often use a business planning tool called a farm enterprise budget. The budget tool relies on detailed spreadsheets of business expenses to project costs and revenue, which can help determine profitability.
Farmers just starting out can use enterprise budget tools provided by university agriculture extension programs. These tools not only help the farmer project whether or not their business might be profitable, but the results also can be helpful when seeking bank loans.
A general business rule is that costs like labor and equipment should not exceed revenue — that is, the total sales of the final product. However, when a business is new, it is likely to operate at a loss for several years.
Revenue depends on two variables: quantity of product sold and the product’s price. In turn, the quantity of product sold and price also depend on two variables: consumer demand and market supply of the product.
There is a direct relationship between demand and price. If demand for the product increases, its price increases.
On the other hand, there is an inverse relationship between product supply and price. If supply of the product increases, its price decreases.

Figure 1 shows the relationship graphically between supply and demand. Price (P) is on the y-axis. The x-axis is defined by the quantity (Q) of product sold. Where S intersects with D is the point at which supply meets demand. You can think of that point as a state of equilibrium.
For a real-world example of how supply changes affect market prices, consider clam production in Florida, which increased significantly from the 1990s through the 2000s. Many small-scale clam farmers claimed they lost half or more of their annual earnings from clam production due to excess market supply.
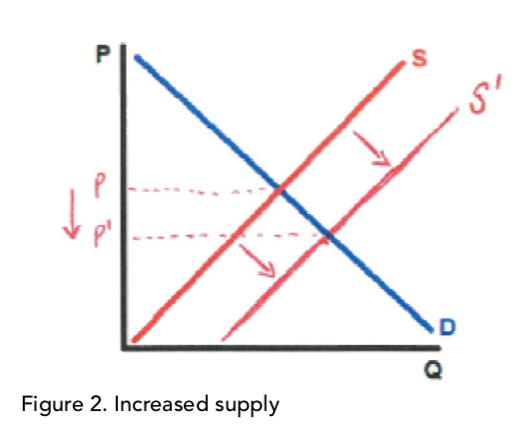
Figure 2 illustrates how increased supply leads to lower prices when demand remains constant. As supply increases from S to S’, price falls from P to P’.
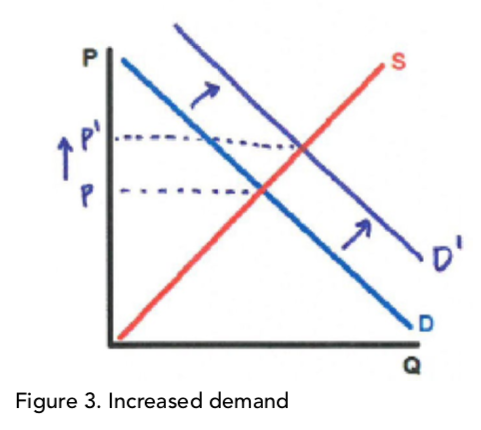
Alternatively, Figure 3 illustrates how increased demand leads to higher prices when supply remains constant. As demand increases from D to D’, price increases from P to P’. This trend is playing out in the cultivated oyster market in North Carolina.
Activity
Materials
- Download the farm enterprise budget tool manual.
- Download the farm enterprise budget tool.
- Download and print the Student Worksheet.
- Download the teacher answer key for the worksheet.
Each student will determine the profitability of a hypothetical oyster aquaculture business. To do so, they will draw on an existing farm enterprise budget tool used by Virginia oyster farmers.
The teacher should provide the Excel-based budget tool and user manual associated with this lesson to the students, along with the Student Worksheet.
The budget tool assesses profitability over a two-year period. The business is considered profitable in a given year if it has a positive value for the “estimated pretax return to land, risk, and management” in row 82 in the “Oyster Crop Budget” tab spreadsheet. This value is the profit, or return on investment, of the business before taxes.
The student’s task is to assess the relationship between profitability and assumptions made within the enterprise budget tool. How much does a business’ profitability depend on assumptions about the price of the product, mortality rates and operating expenses like seed price and labor? This type of assessment is called a sensitivity analysis.
References
- Hudson, K., Kauffman, D., Murray, T.J., and A. Solomon. 2013. Cultchless (Single-Seed) Oyster crop budgets for Virginia. VT/0713/ AAEC-40P. https://www.vims.edu/research/ units/centerspartners/map/aquaculture/docs_aqua/2012OysterBudgetUserManual.pdf
- Crane, K. 2013. Cedar Key’s clam farmers feel squeezed out. The Gainesville Sun. https://www.gainesville.com/story/news/local/2013/06/20/cedar-key-s-clam-farmers/31849155007/