By ART LATHAM
The students and their instructors are up against a bit of a salty breeze as they stroll East, towards the seaward end of the U.S. Army Corps of Engineers’ field and research facility’s pier, suspended 25 feet over the shoreward-rolling waves on North Carolina’s Outer Banks.
But let’s be more specific: the group actually encounters a west-southwest breeze at 7.9 knots, gusting to 8.8 this slightly hazy Spring morning; a barometer at 1,021 millibars and falling; solar radiation at 897.21, the highest of the day; and a rolling swell from the east-southeast, with wave heights of 43 feet, cresting every 5.6 seconds.
The class is enrolled in Terri Kirby Hathaway’s spring semester DataStreme Ocean course. DS-Ocean is a National Oceanic and Atmospheric Administration-funded, American Meteorological Society-sponsored teacher enhancement program. They’ve worked hard and traveled far to win this prize: A session at the internationally recognized FRF in Duck, complete with hands-on learning.
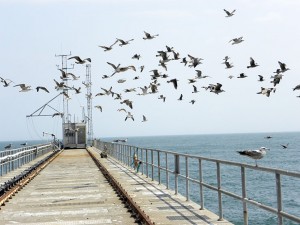
The Field Research Facility Pier is arrayed with data-gathering instruments. Photo by Art Latham.
Had the class been watermen boating similar swells a century — or even a decade — ago, they would have welcomed the copious weather and climate information anyone with computer access can find today, simply by going to FRF’s website, www.frf.usace.army.mil.
The site is loaded with enough sea and atmospheric research data, including that cited above, to choke a humpback whale. Available in near-live time and in archived statistics, the information includes data on waves, tides and ocean currents, fog and other air visibility, nearshore bathymetry — in this case, changing water depths from shore to pier’s end. The site also records water characteristics such as visibility, salinity and temperature, as well as storm histories and much more.
While the FRF instruments record standard meteorological data similar to that your local TV weatherperson offers — air and water temperature, rainfall, humidity, and wind and gust speed and direction — the instruments also record data vital to the facility’s owner, the U.S. Department of Defense.
Kirby Hathaway, North Carolina Sea Grant’s Manteo-based marine education specialist and a certified environmental educator and mentor, is partnering with her husband, Kent Hathaway — hereafter “Terri” and “Kent” — a USACE research oceanographer at the pier. Together with Jane Crosby, like Terri, a certified environmental educator and mentor, the trio forms what DS-Ocean administrators call a Local Implementation Team.
This semester, 25 LITs offered the DS-Ocean course in 25 states, but Terri is the only Sea Grant network educator to lead an LIT.
“I have had students from Florida, West Virginia, Virginia, Massachusetts and Hawaii. South Carolina doesn’t offer it so I will take students from there,” Terri explains.
“I’m really just a facilitator and mentor,” she continues. “I don’t do the teaching: the course participants are self-taught. Students download weekly online chapter materials. We work remotely, and I ship their materials to them. I grade chapter papers each week and report back to them, and I organize the two course meetings and distribute the course materials.”
The final class meeting includes this stroll along the 1,840-foot steel and concrete research pier that usually looms over the Atlantic Ocean waves. “Usually,” because although the pier’s deck, supported on 3-foot diameter steel pilings imbedded 50 to 60 feet below the ocean floor in water 20 feet deep, was designed to stay above storm waves, it has flooded, notably during the 1991 “Halloween storm.”
But today’s class is not risky business, emphasized by the group’s leisurely pace towards the squabble of cackling, circling gulls at the pier’s far end.
HANDS-ON SCIENCE EDUCATION
Terri, in a display of true hands-on education, stops to pick up, examine and display piles of undigested food dropped earlier by the gulls. The scraps include crab parts, fish scales, vertebrae and otoliths, the tiny, bonelike inner-ear structure in fishes.
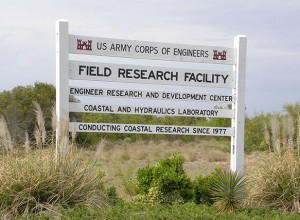
The FRF site sign greets visitors. Photo by Art Latham.
Earlier, Kent led the students around the grounds, pointing out specialized equipment and explaining its uses. For instance, the Coastal Research Amphibious Buggy, called the CRAB — a three-wheeled, nine-ton tripod with an operations platform 35 feet up — can work along the ocean shore’s sometimes-steep angles in almost any weather.
Now, on the pier, the students are ready for a little more hands-on learning.
First, assisted by Terri and by Crosby from the Visual and Performing Arts Center Early College Program in Statesville, they measure the surface current.
Kelly Ondek of the Outer Banks Center for Wildlife Education in Corolla, then Steve Marshall, science teacher at King’s Fork High School in Suffolk, Va., toss a red-painted ply wood piece off the pier’s windward side, while Terri and Ondek time how long it takes the wood to reappear on the pier’s leeward side.
“Knowing the width of the pier and how long it took the plywood to travel that distance, we can determine the distance it moved — onshore or offshore — and the speed of the surface current in feet or meters per second,” Terri explains.
In other observations, Ondek and Marshall measure how deep they can see into the water using a Secchi disk, which measures light penetration in a water column. First Marshall, then Ondek, unwind an attached rope until the disk disappears, then slowly haul it back up until it reappears. The water depth at which it vanishes and reappears is the Secchi disk reading.
Then they winch out the line of a CTD profiler — that’s conductivity, temperature and depth — which collects continuous water column profile data by measuring water conductivity, temperature and depth. The profiler then calculates salinity, density and sound’s speed through the water, displaying data on FRF’s website.
DS-Ocean’s goal is”…to develop a long-term working relationship with DS-Ocean course participants… to upgrade scientific literacy by motivating teachers and through them, their students, to develop and nurture active interests in science, mathematics, and technology.”
RIPPLE EFFECT
Terri, who has facilitated the DS-Ocean class for 14 semesters, is certainly helping DS-Ocean move toward that goal. Knowledge from her classes has rippled outwards through its 98 graduates and, in turn, to their students.
Marsha Anderson, a Gary High School science teacher, was a DS-Ocean student last fall.
“I loved it!” she says. “It really increased my knowledge of ocean science, which is a good thing, since I teach both earth and marine science classes. I have used several of the lab activities and the articles with my students.
“What I like best is the website with the links to so much data in one easily accessed place. It makes it so much easier for my students. I am the Professional Learning Team leader for the Earth Science PLT and I have shared many of the ideas and data with my team. I also had the opportunity to share information about the course with the science department,” Anderson continues.
“Overall, it was a wonderful experience and the materials were great,” she adds.
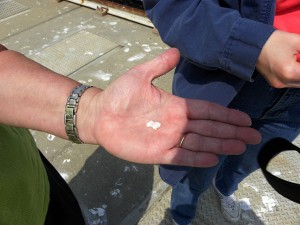
Terri holds otoliths. Photo by Art Latham.
The materials include an inflatable Earth globe, a text and study guide, weekly online ocean news summaries and learning materials based on current water-related environmental events, and continuously updated environmental information from the DS-Ocean homepage.
Denis DuBay, a science teacher at Leesville Road High School in Raleigh, enjoyed reading more about the oceans and their interactions with climate.
“The course helped me decide to incorporate an entire unit on the oceans, something I had not done before. I felt both better prepared to work with my students about ocean topics, and more convinced that those topics were relevant in our earth/ environmental science course. The textbook has the best explanation of Milankovitch cycles I’d seen yet, which 1 have used in my environmental science classes,” he says.
The Milankovitch cycles are the collective effects of changes in the Earth’s movements upon its climate.
Dacia Harris, Asheville High School chemistry and earth and environmental science teacher, agrees about the course’s utility.
“I have a stronger knowledge base and as such am willing to take more risks in my unit planning and experiential learning through the unit,” she notes. “In my classroom, the kids have used the weekly articles and questions to learn more about the importance of and the impact of the oceans. In addition, the class resources have allowed me to revamp my oceanography unit to incorporate more up-to-date information. The students are learning real-time data and, as such, are more engaged with the content.
“One of our main focuses has been to integrate history and global issues into our curriculums so we have worked with our history teachers to look at the impact now and in the past to forecast future events,” Harris continues.
“The high point was… our final day, when we were able to see each other face-to-face. Working together on work that we had only done digitally before was a wonderful experience,” she says.
Finishing up his own day of working in the field, Steve Marshall contemplates the class after teachers and students have returned to shore.
“Because I teach an oceanography class,” he says, “I will be able to incorporate most of the class information in my lessons. When we get to a topic that was covered in the class, I basically take the same lesson, modify it somewhat to meet the level of the class. For example, we are studying waves, so I use the wave analyzer slide chart and accompanying questions presented in the DataStreme course. Geographical and cultural information is provided by some of the links on the course website, so I have used that, too.
“The high points were the instances where course investigations were able to tie different aspects of a topic together. For example, one investigation had temperature and salinity graphs. Information from these graphs was then plotted on a temperature-salinity-density graph, which contained the parameters of different water masses. These plots were then related to a cross-section of the ocean, and the plots on the cross-section corresponded to the depth, salinity and temperature plots on the other graphs,” Marshall adds.
Terri’s marine education and mentoring efforts do not go unnoticed.
“I took the DS-Ocean course in the fall of 2003, just as I came to North Carolina Sea Grant,” Terri says. “I asked then-director Ron Hodson and Jack Thigpen, North Carolina Sea Grant’s extension director, about continuing my association with DS-Ocean and AMS, and they were very supportive.”
Thigpen notes that Terri’s work with NOAA, AMS and the USACE brings state-of-the-art ocean science to teachers.
“This is a great example of a partnership that is building a solid understanding of these processes for the next generation of scientists and researchers,” he adds.
Robert Weinbeck, national DataStreme coordinator, says AMS programs seek to create scientifically literate students who can make responsible decisions as citizens.
“Teachers are the key to this process,” he explains. “Terri is one of our AMS education resource associates who form the conduit between the society’s knowledge and teachers, using her expertise to provide them with the content to be better educators.”
For more on the DataStreme-Ocean course, go to: www.ametsoc.org/amsedu/DS-Ocean/home.html.
This article was published in the Summer 2011 issue of Coastwatch.
For contact information and reprint requests, visit ncseagrant.ncsu.edu/coastwatch/contact/.